Introduction
Supervised learning is a key machine learning method where models are trained on labeled data to make accurate predictions. It powers many AI applications like spam detection, fraud prevention, and medical diagnostics.
At our AI development company, we use supervised learning to build smart, scalable solutions that help businesses automate tasks, gain insights, and enhance user experiences.
Understanding supervised learning is essential for anyone looking to harness the power of AI.

1. Linear Regression

1.1 Type: Regression
1.2 What it is:
Linear Regression is a foundational algorithm in supervised learning, primarily used for predicting continuous numerical outcomes. It works by modeling the linear relationship between one or more input features (independent variables) and a target variable (dependent variable). The model assumes that changes in the output are directly proportional to changes in the input.
This relationship is expressed as a straight-line equation:
Y = aX + b,
where Y is the prediction, X is the input feature, a is the coefficient, and b is the intercept.
1.3 Why it matters:
Linear Regression is favored for its simplicity, interpretability, and speed. It provides valuable insights into how input features affect the outcome, making it useful for analytical tasks and data-driven decision-making. It’s also used as a baseline model before deploying more complex algorithms.
1.4 Use Cases:
- Forecasting monthly or annual sales revenue
- Predicting property prices based on location, size, and amenities
Modeling temperature changes over time for climate studies
1.5 Real-world Example:
A retail company uses Linear Regression to forecast future revenue based on historical sales, marketing expenditure, and seasonal patterns. This helps in inventory planning and budget allocation.
Also Read = Introduction to Machine Learning
2. Logistic Regression
2.1 Type: Classification
2.2 What it is:
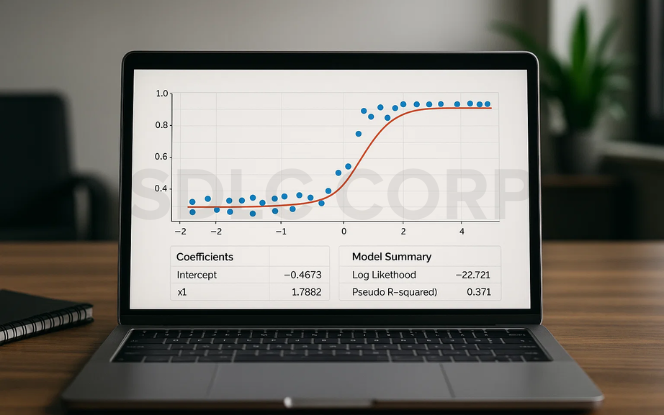
Logistic Regression is a supervised learning algorithm used for classification tasks. It predicts the probability of a given input belonging to a particular category. The key mathematical tool used here is the sigmoid function, which maps any real-valued number into a range between 0 and 1 making it ideal for binary classification.
Despite the name, it doesn’t perform regression but rather estimates likelihoods that are then mapped to classes.
2.3 Why it matters:
Logistic Regression is easy to implement and computationally efficient, making it a go-to choice for many real-world classification problems. It’s especially useful when model transparency and performance trade-offs are critical such as in healthcare or financial domains.
2.4 Use Cases:
- Email spam vs. non-spam classification
- Predicting customer churn in subscription-based businesses
- Diagnosing medical conditions (e.g., predicting diabetes or heart disease)
2.5 Real-world Example:
Banks use Logistic Regression to assess whether a loan applicant poses a credit risk by analyzing their financial history, employment status, and repayment patterns.
3. Decision Trees

3.1 Type: Classification & Regression
3.2 What it is:
A Decision Tree is a flowchart-like model that splits data into branches based on feature values until a decision (output) is made at the leaf node. Each internal node represents a test on a feature, each branch a possible outcome, and each leaf a final decision.
It follows a greedy approach, selecting the best split at each node based on criteria like Gini Impurity or Information Gain.
3.3 Why it matters:
Decision Trees are intuitive, interpretable, and capable of handling both categorical and continuous data. They can model complex, nonlinear relationships without requiring feature scaling or normalization.
3.4 Use Cases:
- Customer segmentation for targeted marketing
- Medical diagnosis systems based on symptoms
- Credit risk analysis and loan eligibility decisions
3.5 Real-world Example:
A healthcare analytics company uses a Decision Tree to help physicians determine the probability of a patient having a specific illness based on age, test results, and medical history.
4. Random Forest

4.1 Type: Ensemble (Classification & Regression)
4.2 What it is:
Random Forest is an ensemble technique that builds multiple decision trees and combines their outputs to improve prediction accuracy. Each tree is trained on a random subset of the data using bootstrapping and selects random features to split at each node, making the model more robust.The final output is obtained through voting (classification) or averaging (regression).
4.3 Why it matters:
Random Forests reduce the risk of overfitting that single decision trees often face. They handle large datasets efficiently, provide feature importance scores, and work well with missing data and noisy datasets.
4.4 Use Cases:
- Detecting fraudulent transactions in financial services
- Powering personalized recommendation engines in eCommerce
- Forecasting trends in large-scale financial data
4.5 Real-world Example:
An eCommerce giant uses Random Forest models to analyze customer behavior and recommend products based on browsing history, past purchases, and similar user profiles.
5. Support Vector Machines (SVM)
5.1 Type: Classification
5.2 What it is:
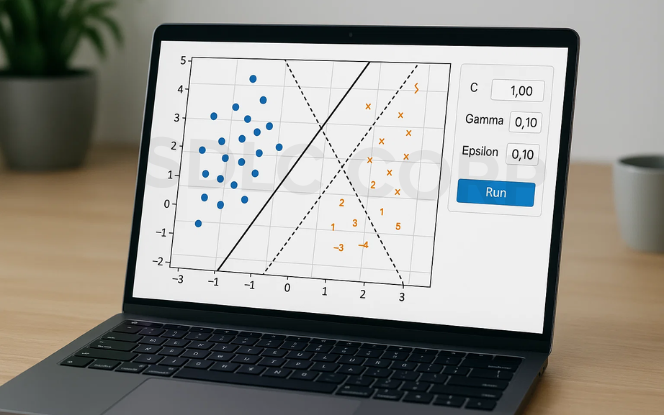
Support Vector Machines are supervised learning algorithms that classify data by finding the best hyperplane that separates data points of different classes. The objective is to maximize the margin between the closest data points of each class, known as support vectors.
SVMs can also handle non-linear classification by using kernel functions (e.g., RBF, polynomial) to project data into higher dimensions where a linear separator exists.
5.3 Why it matters:
SVMs are powerful in high-dimensional spaces and perform well in complex scenarios such as image and text classification. They are less prone to overfitting and maintain good generalization, especially with well-separated data.
5.4 Use Cases:
- Handwritten digit recognition
- Categorizing documents by topic
- Sentiment analysis from customer reviews
5.5 Real-world Example:
A law-tech startup uses SVM to automatically categorize legal documents into types like contracts, leases, and affidavits, making legal workflows more efficient.
6. K-Nearest Neighbors (KNN)
6.1 Type: Classification & Regression
6.2 What it is:
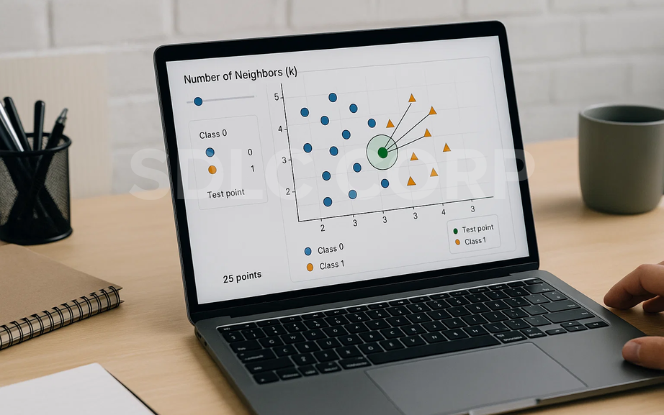
KNN is a simple yet effective algorithm that classifies a new data point based on the majority vote (classification) or average (regression) of its ‘k’ nearest neighbors. Distance metrics like Euclidean or Manhattan are used to measure closeness.
It’s called a lazy learner because it doesn’t build a model in advance but rather stores the training dataset and performs calculations at prediction time.
6.3 Why it matters:
KNN requires no training phase, which can be advantageous for small datasets. It adapts naturally to complex class boundaries and is ideal for pattern recognition where similarity is key.
6.4 Use Cases:
- Recommender systems for eCommerce and streaming platforms
- Customer segmentation and behavior prediction
- Facial recognition and biometric authentication
6.5 Real-world Example:
A retail analytics platform uses KNN to recommend new items by comparing a customer’s purchase patterns to similar shoppers in their database.
Also Read = large language models
7. Naive Bayes
7.1 Type: Classification
7.2 What it is:
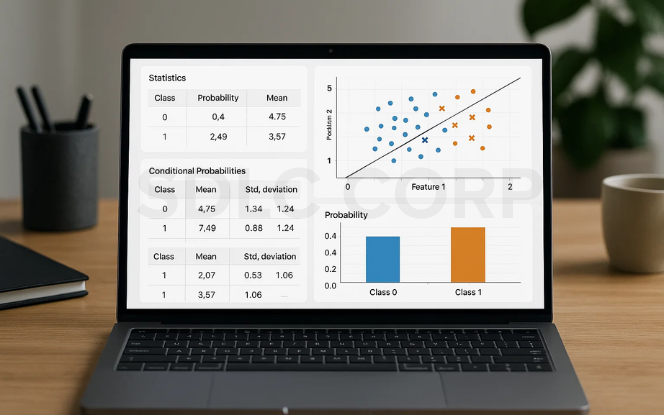
Naive Bayes is a family of probabilistic classifiers based on Bayes’ Theorem. It assumes independence among features, which is rarely true in reality but simplifies calculations significantly.
Variants like Gaussian, Multinomial, and Bernoulli Naive Bayes are tailored for different types of data from continuous features to word counts in documents.
7.3 Why it matters:
Naive Bayes is extremely fast and efficient, making it ideal for high-dimensional problems such as text classification and spam filtering. Despite its simplicity, it performs surprisingly well in many real-world applications.
7.4 Use Cases:
- Spam detection in email systems
- Text classification in content management
- Real-time sentiment analysis on social media
7.5 Real-world Example:
A social media monitoring tool uses Naive Bayes to scan tweets and posts to determine the public sentiment toward a brand during product launches or crises.
8. Gradient Boosting (XGBoost, LightGBM, CatBoost)

8.1 Type: Ensemble (Classification & Regression)
What it is:
Gradient Boosting builds models sequentially, where each new model attempts to correct the errors made by its predecessor. It optimizes a loss function and combines weak learners (usually decision trees) into a strong ensemble.
Tools like XGBoost, LightGBM, and CatBoost have made gradient boosting highly efficient and scalable even with large and complex datasets.
8.2 Why it matters:
Gradient Boosting algorithms consistently rank at the top in machine learning competitions (e.g., Kaggle). They handle missing data, non-linear relationships, and mixed feature types with high precision and are widely used in mission-critical AI applications.
8.3 Use Cases:
- Ranking algorithms in search engines
- Predictive maintenance in manufacturing
- Ad click-through rate optimization in marketing
8.4 Real-world Example:
A digital advertising firm uses XGBoost to predict which ads a user is most likely to click on, allowing for real-time bidding and more effective audience targeting.

Conclusion
Supervised learning powers many of today’s intelligent systems from fraud detection to healthcare diagnostics by learning from labeled data to make accurate predictions.
Each technique has its strengths:
- Regression for simplicity and speed
- Decision Trees & Random Forests for flexibility
- SVM & KNN for pattern recognition
- Naive Bayes for text classification
- Gradient Boosting for high performance
At SDLC Corp, we harness these tools to build AI solutions that optimize operations, enhance customer experiences, and drive growth. With the right strategy, supervised learning delivers real, scalable results.
FAQs
1. What is supervised learning in machine learning?
Supervised learning is a method where models are trained on labeled data meaning each input is paired with a correct output. The goal is to learn a mapping from inputs to outputs for making accurate predictions on new data.
2. What’s the difference between supervised and unsupervised learning?
- Supervised learning uses labeled data to make predictions.
- Unsupervised learning works with unlabeled data to find hidden patterns or groupings, like in clustering or anomaly detection.
3. Which supervised algorithm should I use?
It depends on your problem:
- Use Linear Regression for continuous predictions.
- Use Logistic Regression, SVM, or Naive Bayes for classification.
- Use Random Forest or Gradient Boosting for high accuracy and handling complex data.
- KNN is ideal for simple pattern-based matching.
Testing multiple models and comparing results is usually the best approach.
4 .How do I evaluate supervised learning models?
Common evaluation metrics include:
- Accuracy, Precision, Recall, F1-score (for classification)
- Mean Squared Error (MSE), Root Mean Squared Error (RMSE) (for regression)
- Use cross-validation for more reliable model validation.
5. Can supervised learning be used in real-time applications?
Yes. Many supervised models (especially Logistic Regression, SVM, and Gradient Boosting) are used in real-time systems for fraud detection, recommendation engines, ad targeting, and more.
6. Can I implement these models in my business systems?
Absolutely. With the help of a trusted AI development partner, you can train, test, and deploy supervised learning models in production whether through cloud APIs, embedded systems, or enterprise applications.