What are the types of charts in odoo 18
Introduction
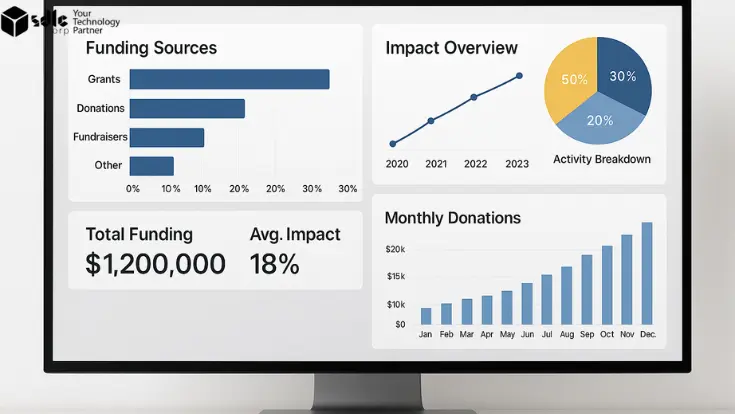
Odoo 18 offers several types of charts to visualize data effectively in various modules like Sales, CRM, Accounting, and more. These include:
- Bar Chart: Displays data in vertical or horizontal bars.
- Line Chart: Represents data trends over time with lines connecting data points.
- Pie Chart: Shows data proportions in a circular format.
- Stacked Bar Chart: Highlights parts of a whole in a bar format.
- Donut Chart: A variation of the pie chart with a hole in the center.
- Pivot Chart: Provides multidimensional data analysis.
- Kanban View Charts: Charts integrated into kanban views for specific records.
Supercharge Growth with Odoo Experts!
Tailored Odoo Solutions for Streamlined Business Efficiency and Growth
Steps to Open a Chart in Odoo 18
Follow these steps to access and view charts in Odoo 18:
1. Navigate to the Module
- Go to the module where you want to visualize data, such as Sales, CRM, or Accounting.

2. Open the List or Report View
- For data visualization, ensure you are in the appropriate data list or reporting section of the module.
3. Switch to Graph View
- Locate the graph view button (usually on the top-right corner of the interface) or select Graph from the view toggle options.
4. Select the Chart Type
- Once in the graph view, use the chart type selector to switch between:
- Bar Chart
- Line Chart
- Pie Chart
- Other available types, depending on the module.

5. Apply Filters and Groupings
- Use the filters and group-by options to refine the data displayed in the chart. For example:
- Filter by date range, user, or status.
- Group data by categories like product, salesperson, or customer.
6. Customize the Chart (Optional)
- Adjust chart settings like:
- Measures: Choose the metric to visualize (e.g., revenue, quantity).
- Time Range: Select a specific period to display (e.g., weekly, monthly).
- Comparisons: Add a comparison line for trends over periods.

7. Save or Export
- Save the chart view for quick access in the future or export it as needed for presentations or reports.
Conclusion
Odoo 18 provides a wide variety of chart types to analyze and visualize business data effectively. By following these steps, you can access and customize charts across different modules to gain valuable insights into your operations.
Expert Odoo ERP Solutions Tailored
Streamline Operations and Boost Growth with Odoo ERP Solutions
How SDLC CORP Can help to create different types of charts in odoo 18?
SDLC Corp offers expert Odoo development services to help businesses optimize their operations with tailored solutions. As one of the top Odoo development companies, they specialize in Odoo custom development, Odoo application development, and Odoo ecommerce development, providing scalable, integrated solutions to meet specific business needs. Whether you want to hire Odoo developers or hire Odoo experts, SDLC Corp ensures seamless implementation and support, helping businesses fully leverage Odoo for growth and efficiency.


