
Introduction
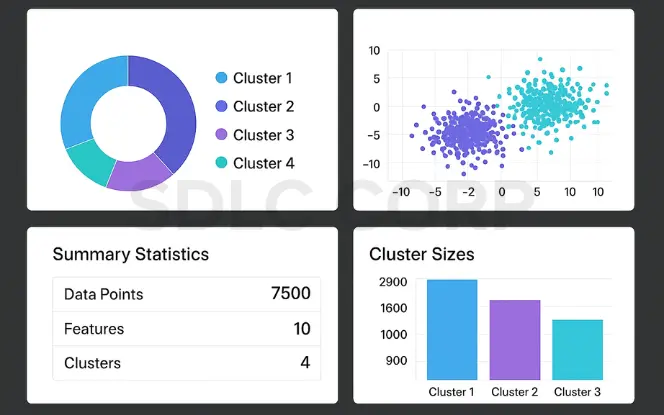
Unsupervised learning is a key area of machine learning where algorithms identify patterns in data without labeled outcomes. It helps uncover hidden structures, reduce dimensionality, and group data effectively.
An AI development company uses unsupervised learning for real-world tasks like customer segmentation and anomaly detection, enabling smarter decision-making across industries such as marketing and cybersecurity.
What is Unsupervised Learning?
Definition
Unsupervised learning is a machine learning technique that trains models on unlabeled data. The goal is to uncover hidden structures, groupings, or patterns within datasets without human-provided output labels.
Example
Imagine you have thousands of images of animals but no labels like “cat” or “dog.” An unsupervised model can group visually similar images together, discovering categories by itself.
Also Read – Introduction to Machine Learning
How Unsupervised Learning Works
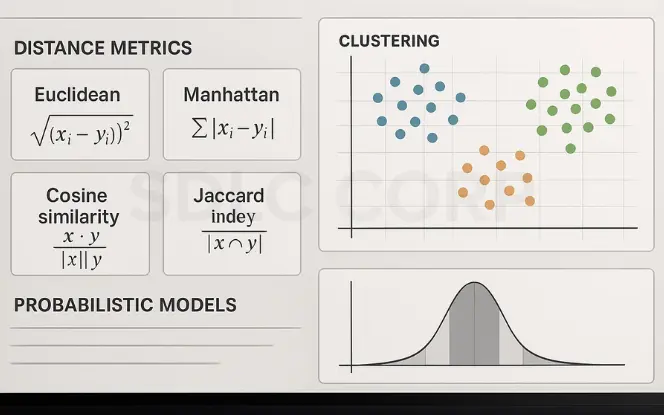
At its core, unsupervised learning algorithms look for statistical regularities and similarities in the input data. It uses:
- Distance metrics (like Euclidean distance)
- Probabilistic models
- Linear algebra (e.g., eigenvectors, matrices)
- Graph theory (for connectivity and hierarchy)
Unlike supervised learning (which minimizes prediction error), unsupervised models optimize for compactness, separation, or information gain.
Self-Supervised Learning: Bridging the Gap
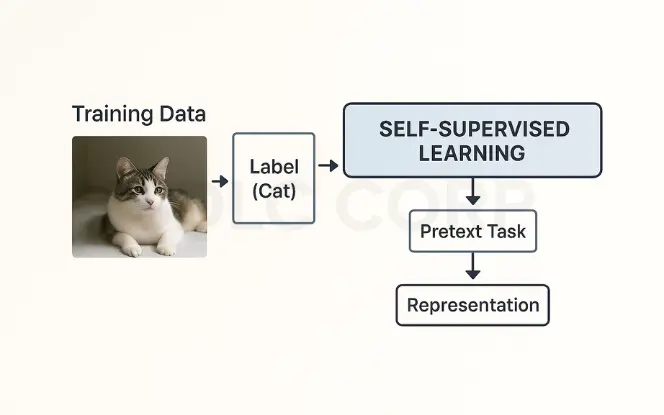
Self-supervised learning is an emerging paradigm that blends the strengths of both supervised and unsupervised learning. Unlike traditional supervised learning, which requires large amounts of labeled data, self-supervised methods generate their own labels from the raw data, allowing models to learn meaningful representations without manual annotation.
How It Works
- A model learns to predict part of the input from other parts.
- This pretraining step captures semantic structure in the data.
- After pretraining, the model can be fine-tuned on smaller labeled datasets for downstream tasks.
Popular Self-Supervised Methods
| Method | Description | Use Case |
|---|---|---|
| SimCLR | Learns visual representations through contrastive learning | Computer vision |
| BYOL | Bootstrap Your Own Latent – avoids negative samples | Vision, video |
| MoCo | Momentum contrast – builds memory bank of features | Large-scale visual learning |
| Masked Language Modeling (MLM) | Predict missing words in text (used in BERT) | NLP |
Example: Large Language Models (LLMs) and Self-Supervised Learning
Large Language Models (LLMs) such as GPT, BERT, and T5 are shining examples of how self-supervised learning is revolutionizing natural language processing (NLP), coding assistants, and even general AI.
These models are trained not with manually labeled datasets, but by creating pretext tasks from raw text making them powerful, scalable, and highly generalizable.
BERT (Bidirectional Encoder Representations from Transformers)
Training Objective: Masked Language Modeling (MLM)
Mechanism: BERT randomly masks 15% of the input tokens and trains the model to predict the missing words.
Example:
Input: “The cat sat on the [MASK].”
Output: “mat”Result: BERT learns context in both directions, making it excellent for sentence classification, named entity recognition, and question answering.
GPT (Generative Pre-trained Transformer)
Training Objective: Autoregressive Language Modeling
Mechanism: GPT learns to predict the next word in a sentence using only the previous words as context.
Example: Input: “Once upon a” Output: “time”
Result: GPT models are well-suited for text generation, code completion, dialogue systems, and more.
Evaluation Metrics for Unsupervised Learning
Since unsupervised learning lacks labels, traditional accuracy metrics don’t apply. Instead, we use metrics that evaluate the structure and compactness of clusters or the quality of learned features.
Key Metrics
| Metric | Description | Application |
|---|---|---|
| Inference Latency | Time taken by the model to generate an output for a given input | Real-time applications, chatbots, assistants |
| Throughput | Number of inferences the model can handle per second | Batch processing, scaling inference |
| GPU Utilization | Percentage of GPU resources consumed during inference | Performance optimization, cost efficiency |
| Token Accuracy | Accuracy of generated tokens against expected output | Text generation quality, summarization |
| Model Confidence Score | How confident the model is in its predictions | Decision-making systems, AI auditing |
| Memory Footprint | Amount of memory used during model execution | Edge deployment, resource planning |
| Quantization Efficiency | Improvement in speed and size after applying quantization | Model compression, mobile AI apps |
Real-World Case Studies

Bringing theory into real-world practice, here are 4 concise case studies where unsupervised learning drives impact:
Healthcare: Patient Risk Clustering
Use: K-Means clustering on medical records
Outcome: Identify high-risk patient cohorts for early intervention
Impact: Reduced hospital readmission rates
Finance: Fraud Detection
- Use: Isolation Forests for anomaly detection on transaction logs
- Outcome: Uncovered rare, subtle fraudulent behavior
- Impact: Saved millions in potential fraud losses
E-commerce: Customer Segmentation
- Use: DBSCAN and PCA on browsing/purchase data
- Outcome: Identified shopper personas (bargain-hunters, loyalists)
- Impact: Personalized marketing increased conversion by 20%
NLP: Topic Modeling in News Articles
- Use: LDA on large corpus of political news
- Outcome: Discovered hidden topics like “elections,” “diplomacy,” “policy”
- Impact: Powered content recommendation and summarization tools
Algorithm Comparison & Decision Framework
Choosing the right unsupervised learning algorithm is critical for meaningful results. Each algorithm has unique strengths and is better suited to specific data types, noise levels, dimensionality, and business goals. Below is a practical comparison and decision-making framework to guide you.
Comparative Overview of Common Algorithms
| Algorithm | Best For | Noise | Output |
|---|---|---|---|
| K-Means | Simple clusters | No | Labels |
| DBSCAN | Irregular shapes | Yes | Core/Noise |
| Hierarchical | Small datasets | No | Dendrogram |
| PCA | Reduce dimensions | Partial | Features |
| t-SNE / UMAP | 2D/3D plots | Partial | Embeddings |
| Autoencoders | Deep features | Partial | Latent space |
| LDA | Text topics | Partial | Topics |
| SOM | Visual maps | Partial | 2D map |
Quick Recommendations by Use Case
| Use Case | Recommended Algorithm(s) |
|---|---|
| Customer Segmentation | K-Means, DBSCAN, SOM |
| Anomaly Detection | Isolation Forest, DBSCAN, Autoencoders |
| Product Recommendation | Collaborative Filtering, PCA |
| Topic Modeling in NLP | LDA, NMF, Word2Vec + Clustering |
| Visualizing Complex Datasets | t-SNE, UMAP, PCA |
| Feature Extraction / Compression | Autoencoders, PCA |
| Image Clustering | CNN + SOM, Autoencoders, K-Means |
Challenges in Unsupervised Learning
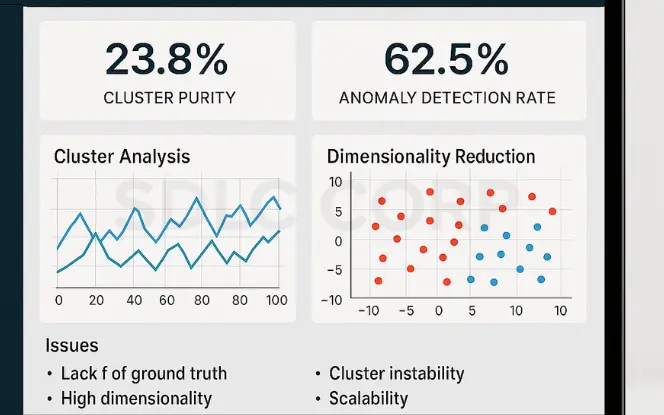
Unsupervised learning offers tremendous potential, but it also presents distinct challenges that can hinder model effectiveness and reliability. Understanding these obstacles is essential for successful implementation, tuning, and interpretation.
1. Lack of Ground Truth
Unlike supervised learning, unsupervised models operate without labeled outcomes, making it difficult to directly measure accuracy or success.
Why it matters:
- There’s no “right answer” to compare with.
- Evaluation often relies on heuristics, visual inspection, or domain expertise.
Common workaround:
Use metrics like Silhouette Score, Davies-Bouldin Index, or Calinski-Harabasz Index to assess clustering quality indirectly.
2. Noise Sensitivity
Many algorithms (e.g., K-Means) are vulnerable to outliers and poor initialization. Even a few noisy points can skew centroids and degrade clustering results.
Why it matters:
- Can result in unstable clusters or poor convergence.
Solution: - Use robust models like DBSCAN, HDBSCAN, or Gaussian Mixture Models (GMM).
- Apply preprocessing: scaling, normalization, and outlier removal.
3. Interpretability
Clusters in unsupervised learning don’t have predefined meanings, making them harder to interpret.
Why it matters:
- Output often lacks context unless labeled post-hoc.
- You need domain knowledge to draw insights.
Solution: - Visualize with t-SNE, UMAP, or dendrograms.
- Engage domain experts for post-analysis and labeling
4. Scalability and Efficiency
Some unsupervised algorithms struggle with large datasets or real-time applications.
Why it matters:
- Hierarchical clustering and t-SNE can be computationally intensive.
Solution: - Use MiniBatch K-Means, approximate methods, or sampling strategies.
- Implement distributed computing with frameworks like Apache Spark or Dask.
5. Model Validation and Generalization
It’s hard to determine whether unsupervised models will generalize well to new data.
Why it matters:
- A model that performs well on one dataset may fail in a slightly different context.
Solution: - Combine with semi-supervised learning when possible.
- Validate on diverse subsets or bootstrapped samples.
Choosing the Right Algorithm
Not every unsupervised algorithm fits every dataset. Here’s a guide to help you choose based on data characteristics:
| Data Scenario | Recommended Algorithm | Why |
|---|---|---|
| Low-dimensional, spherical clusters | K-Means | Fast and interpretable |
| Noisy data with outliers | DBSCAN, HDBSCAN | Handles noise and density variations |
| High-dimensional data | PCA, Autoencoders | Dimensionality reduction |
| Non-linear manifold structures | t-SNE, UMAP | Better for visualization |
| Sequential/temporal data | Hidden Markov Models, RNN Autoencoders | Captures sequence information |
| Text data | LDA, Word2Vec, Doc2Vec | Designed for NLP tasks |
Unsupervised Learning vs. Supervised Learning: A Detailed Comparison
| Feature / Aspect | Supervised Learning | Unsupervised Learning |
|---|---|---|
| Data Type | Labeled data (input + output pairs) | Unlabeled data (only input, no output) |
| Objective | Learn a mapping from inputs to known outputs (prediction/classification) | Discover hidden patterns or groupings in the data |
| Common Algorithms | Linear Regression, Decision Trees, SVM, Neural Networks | K-Means, DBSCAN, PCA, Autoencoders |
| Examples | Email spam detection, Credit scoring, Image classification | Customer segmentation, Market basket analysis, Anomaly detection |
| Output | Predictive values or classes | Clusters, groups, or reduced feature representations |
| Evaluation Metrics | Accuracy, Precision, Recall, F1 Score | Silhouette Score, Davies-Bouldin Index, Reconstruction Error |
| Human Intervention | Required to label training data | Not required for training; results may need interpretation |
| Training Process | Guided with known answers (labels) | Exploratory and self-guided |
| Use Case Suitability | Best when historical outcomes are known | Best when discovering patterns or structure is the goal |
| Scalability | May require large labeled datasets | Scales easily with large unlabeled datasets |
| Dependency on Domain Knowledge | High — labels and features must be meaningful | Moderate — interpretation may need domain expertise |
| Complexity of Interpretation | Often easier to explain predictions | Often harder to interpret clusters or embeddings |
Also Read – Large Language Models
Self-Organizing Maps (SOMs): A Neural Approach to Clustering
Self-Organizing Maps (SOMs) are a type of unsupervised neural network developed by Teuvo Kohonen that projects high-dimensional data into a lower-dimensional (typically 2D) space while preserving topological relationships. They are especially useful for visualizing, clustering, and exploring high-dimensional data in a human-interpretable format.
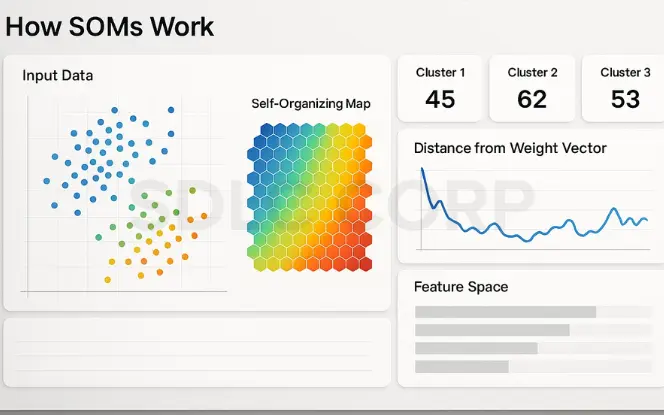
How SOMs Work
SOMs consist of a grid of interconnected nodes (neurons), each associated with a weight vector. During training:
- An input vector is compared to all nodes to find the Best Matching Unit (BMU).
- The BMU and its neighboring nodes adjust their weights to become more like the input.
- This process preserves spatial relationships in the data over time.
The result is a 2D map where similar data points activate nearby neurons, making it easier to see clusters and patterns.
Key Features of SOMs
- Topology Preservation: Similar inputs are mapped close together.
- Dimensionality Reduction: Projects complex datasets into 2D or 3D grids.
- Unsupervised Clustering: SOMs naturally form clusters in the map space.
- Visual Interpretation: Great for pattern recognition, data exploration, and outlier detection.
Common Use Cases
| Industry | Application |
|---|---|
| Healthcare | Gene expression clustering |
| Finance | Fraud detection and customer segmentation |
| Image Processing | Texture classification, image compression |
| Marketing | Market segmentation and behavior analysis |
| IoT/Networks | Intrusion detection, sensor data clustering |
Advantages of SOMs
- No need to predefine the number of clusters (like in K-Means)
- Easy to visualize complex data structures
- Works well with non-linear relationships
Limitations
- Requires tuning (grid size, learning rate, neighborhood function)
- Slower than simpler methods like K-Means
- Interpretation of output sometimes requires experience
Contrastive Learning in Vision Transformers (ViTs) Unsupervised Approach
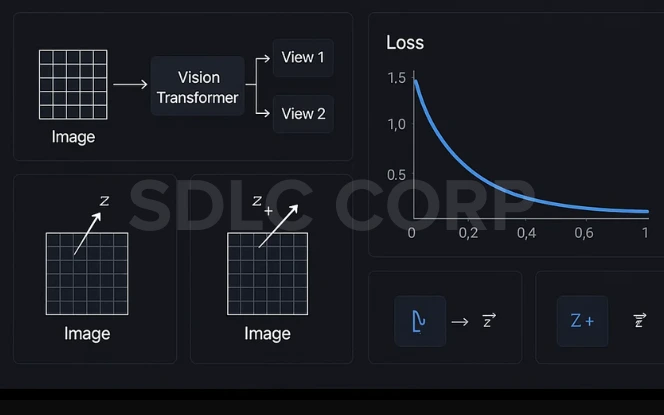
Contrastive Learning is a self-supervised learning technique where the model learns to distinguish between similar and dissimilar data points. When applied to Vision Transformers (ViTs), it enables powerful unsupervised image representation learning without requiring manually labeled data.
What is Contrastive Learning?
Contrastive learning teaches a model to bring positive pairs (e.g., different augmentations of the same image) closer in embedding space, while pushing negative pairs (different images) farther apart.
Positive Pair: Same image, differently augmented (e.g., crop, flip)
Negative Pair: Two distinct images
Popular contrastive learning frameworks:
SimCLR (Simple Contrastive Learning of Representations)
MoCo (Momentum Contrast)
BYOL (Bootstrap Your Own Latent) does not use negative pairs
Key Benefits
No labeled data needed
Produces generalizable image features
Performs competitively on downstream tasks (e.g., classification, detection)
Helps ViTs outperform CNNs in low-label or few-shot settings
Variational Autoencoders (VAEs) – Explained
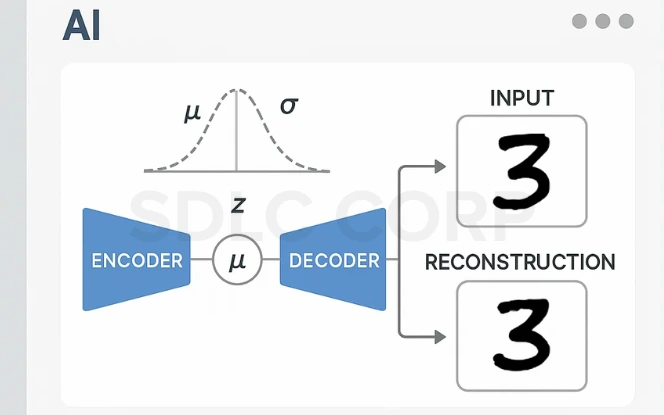
A Variational Autoencoder (VAE) is a type of generative model and unsupervised learning framework that learns to encode data into a probabilistic latent space, and then reconstructs it. Unlike traditional autoencoders, VAEs impose a distributional constraint on the latent space, enabling controlled sampling and generative tasks.
Why Use VAEs?
| Benefit | Description |
|---|---|
| Generative Power | Can sample new, realistic data points from latent space |
| Continuous & Structured Latents | Latent space is smooth and interpretable |
| Semi-supervised Friendly | Can be adapted for limited labels |
| Disentangled Representations | Useful for explainable AI and factor analysis |
Popular Extensions
β-VAE: Introduces disentanglement
CVAE (Conditional VAE): Conditioning on class labels
VQ-VAE: Discrete latent space for audio/video generation
SVAE, IWAE, DVAE: Variants for improved inference or flexibility
Hybrid Methods in Unsupervised Learning
Hybrid methods in unsupervised learning combine the strengths of multiple learning paradigms especially unsupervised, supervised, and ensemble techniques to achieve more robust, scalable, and interpretable results.
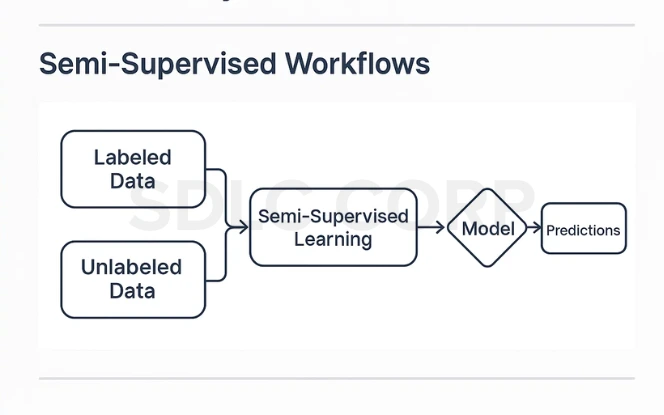
Semi-Supervised Workflows
Semi-supervised learning sits between supervised and unsupervised approaches. It uses a small amount of labeled data with a large pool of unlabeled data to improve model performance.
Key Approaches:
- Label Propagation: Spreads known labels across a similarity graph.
- Pseudo-Labeling: Uses the model’s confident predictions as synthetic labels.
- Co-Training: Two models train on different views and teach each other.
Benefits:
- Reduces labeling costs
- Improves performance when labels are scarce
- Enables weak supervision or bootstrapping for domain-specific problems
Ensemble Clustering (Consensus Clustering)
Instead of relying on a single clustering algorithm, ensemble clustering aggregates results from multiple models or runs to produce a more stable and accurate consensus.
Key Techniques:
Co-association Matrix: Combines different clusterings into a similarity matrix
Voting or Co-occurrence Strategy: Final label chosen by majority agreement
Graph Partitioning: Builds a graph based on base clusterings and partitions it
Benefits:
Reduces sensitivity to initialization/randomness
Handles noisy or ambiguous data more effectively
Enhances generalization by capturing diverse views
Visual Summary (Styled Table)
| Hybrid Technique | Description | Benefits |
|---|---|---|
| Semi-Supervised Learning | Combines labeled and unlabeled data to improve model accuracy |
|
| Ensemble Clustering | Merges multiple clustering results to create a consensus solution |
|
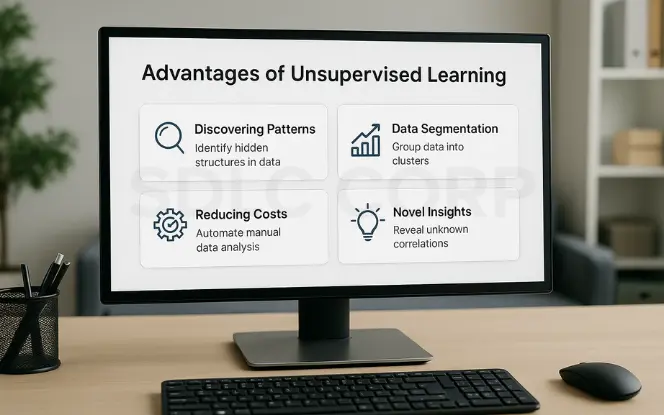
Advantages of Unsupervised Learning
Unsupervised learning offers several key benefits that make it essential in modern data science and AI applications:
1. No Need for Labeled Data
One of the biggest advantages is that unsupervised learning doesn’t require labeled datasets, which are often expensive and time-consuming to create. It can process raw, unannotated data, making it ideal for early-stage data exploration or domains where labels are scarce.
2. Reveals Hidden Patterns and Structures
Unsupervised algorithms are excellent at uncovering hidden structures, correlations, and natural groupings within complex datasets. This is especially useful in discovering insights that may not be obvious through manual analysis.
3. Useful for Preprocessing and Feature Engineering
Techniques like PCA or autoencoders help reduce dimensionality, remove noise, and generate meaningful features. These representations can improve the performance and speed of supervised models.
4. Flexible Across Domains and Data Types
Unsupervised learning is adaptable across various industries and data formats whether it’s images, text, audio, or sensor data. It powers applications like market segmentation, fraud detection, and topic modeling.
5. Supports Real-Time Analysis and Anomaly Detection
Algorithms like DBSCAN or Isolation Forest can continuously monitor streams of data and flag anomalies without needing predefined labels, making them perfect for real-time fraud detection, cybersecurity, and IoT analytics.
Conclusion
Unsupervised learning is a powerful tool for exploring and understanding data. While it lacks labeled supervision, its ability to reveal hidden structures makes it indispensable in modern AI applications. As part of comprehensive AI development services, unsupervised learning enables businesses to extract meaningful insights from raw, unlabeled datasets.
Whether you’re clustering customer profiles or reducing image dimensions, mastering unsupervised learning opens the door to powerful machine learning workflows without the burden of manual labeling.
FAQs
1. What is Unsupervised Learning?
Unsupervised learning is a machine learning approach where models are trained on unlabeled data. The goal is to discover patterns, groupings, or structures hidden in the data without human supervision. It’s commonly used for clustering, dimensionality reduction, and anomaly detection.
2. Is feature scaling important in unsupervised learning?
Yes. Most unsupervised algorithms (like K-Means, PCA) are sensitive to the scale of features. It’s best to normalize or standardize data beforehand.
3. Can unsupervised learning be combined with supervised learning?
Absolutely. This is called semi-supervised learning or self-supervised learning. Unsupervised methods help structure or pre-train data, which is later fine-tuned using labeled data.
4. When should I use Unsupervised Learning?
Use unsupervised learning when you lack labeled data or want to explore unknown patterns. It’s ideal for customer segmentation, outlier detection, and feature discovery. It’s also useful in preprocessing for supervised models.
5. How do you evaluate results without labels?
Without ground truth, evaluation relies on metrics like Silhouette Score, Davies–Bouldin Index, and Calinski-Harabasz. Visualizations using t-SNE or PCA also help understand clustering or data separation quality.
6. Can Unsupervised Learning be used in Natural Language Processing (NLP)?
Yes, unsupervised learning plays a key role in NLP tasks like topic modeling, document clustering, and word embeddings. Models such as LDA and Word2Vec help uncover hidden semantic structures in text without labeled data. It’s widely used in search engines, chatbots, and content recommendation systems.
7. Is Self-Supervised Learning the same as Unsupervised Learning?
Self-supervised learning is a subset of unsupervised learning where the system generates its own labels from raw data. It powers models like BERT and GPT, which learn language patterns by predicting masked or sequential tokens. This technique bridges the gap between unsupervised data exploration and supervised task performance.