Winning a single iGaming player now costs somewhere between $250 and $500, and well over $800 in sports betting during peak events. So when an active player goes quiet and nobody notices, you're watching paid acquisition walk straight out the door.
The problem is almost always timing. Most teams only confirm a player has left long after they've actually gone. By that point they've signed up with a competitor, and winning them back costs far more than keeping them ever would have.
That quiet stretch in between is the part most operators skip. They'll spend heavily to acquire players, then spend again on big reactivation pushes, but they miss the weeks when a fading player is still reachable. Reading those weeks correctly is how you protect revenue you've already paid for.
Key Takeaways
- Churn is a process, not a single event. Players send behavioral signals for days or weeks before they stop depositing.
- Detecting beats reacting. The earlier you catch disengagement, the more players you keep, and the cheaper it is.
- A small core funds most revenue. Somewhere around 2% of players can account for more than half of total earnings.
- Eight signals flag churn early. Falling logins, widening deposit gaps, smaller sessions, and ignored bonuses all show up before revenue drops.
- Respond fast. A quick, personal nudge usually recovers more players than a bigger bonus.
- Retention is the cheaper bet. Keeping a player costs roughly five to seven times less than acquiring a new one.
What Is Player Churn in iGaming?
Player churn is when an active player stops depositing or placing bets for a defined period of time. It's the clearest signal that lifetime value is leaking: a churned player stops generating gross gaming revenue (GGR) and stops responding to your campaigns.
Most operators count a player as churned after 30 days with no real bets or deposits. Others use a tighter 14-to-21-day window, depending on how often their players normally come back. The right number comes from your own data, not from a fixed industry rule.
How Is Player Churn Rate Calculated?
Churn rate is a straightforward division: the number of players lost during a period, divided by the number you started with.
Start a month with 2,000 active players, lose 200 of them, and your monthly churn rate is 10%. Track this by cohort and by player value rather than as a single site-wide figure, because losing ten casual players is nothing like losing one VIP.
Soft Churn vs Hard Churn
Soft churn
A soft-churning player is slowing down but still around. They still log in occasionally and open the odd email.
Hard churn
A hard-churned player has stopped completely.
Detection lives in that soft-churn window. Once a player crosses into hard churn, you're no longer detecting anything; you're running a reactivation campaign, which is harder, slower, and more expensive.
Churn Looks Different Across Verticals
The same signal can mean different things depending on the product. A sportsbook bettor might go quiet between major events and return on their own, so a 30-day gap can be perfectly normal. A daily slots player who disappears for three days is a far louder warning. Set your detection windows per vertical and per segment, or you'll keep mistaking normal rhythms for risk.
Why Player Churn Matters: The Real Cost

Churn hurts because your revenue isn't spread evenly. A peer-reviewed study of player lifetime value by Silicon Studio found that just 2% of players, the so-called whales, generate up to 50% of a game's total revenue. Lose even a handful of those high-value accounts and it lands hard on the bottom line.
The Economics of Acquisition vs Retention
The math sits firmly on the side of retention. Research by Bain & Company, published in Harvard Business Review, puts the cost of acquiring a new customer at five to 25 times that of keeping an existing one, and in competitive markets like iGaming the gap typically runs five to seven times. Acquisition keeps getting pricier as markets tighten, so repeat deposits from loyal players are what actually sustain margin. Every quiet exit is money you already spent and lost.
Why Early Detection Pays Off
The retention curve is what makes speed so important. GameAnalytics benchmarks covering more than 10,000 mobile titles put median Day 1 retention between 23 and 28% and Day 7 under 10%, and a large share of that drop is avoidable when teams catch the warning signs in time. Acting on the first day of disengagement is cheap and it works. Acting three months later, after a player has gone dark, rarely does.
Closing that early-signal gap is exactly what iGaming CRM software that flags at-risk players is built for.
How Do You Spot a Player About to Churn? The 8 Early-Warning Signals

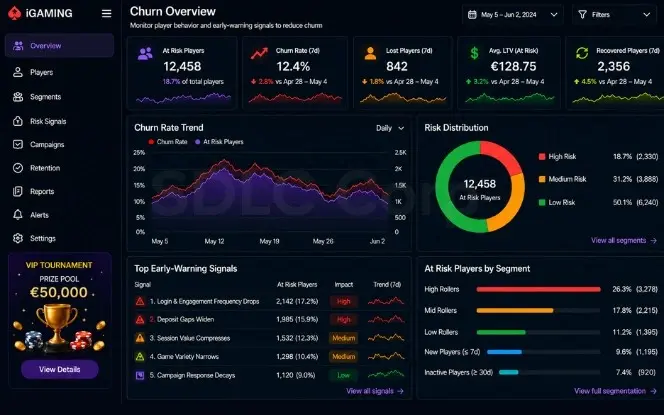
Players rarely leave without warning. They leave a trail, and it usually surfaces in these eight behaviors, roughly in the order below. Each one includes what to measure and why it's an early flag.
Login and Engagement Frequency Drops
A 25-to-40% fall against a player's own routine is one of the very first signs, often arriving before any change in deposits. Measure active days per week and session count over a rolling 14 days, and always compare a player to their own baseline rather than a site average.
Deposit Gaps Widen
When it comes to deposits, timing predicts churn better than amount. A player who usually deposits every three days stretching out to nine is a clear flag, even if the deposit size hasn't budged. Track the average days between deposits and how far the current gap has drifted from that player's normal cycle.
Session Value Compresses
Plenty of churn begins as a slow downshift rather than a sudden disappearance. Smaller bets, shorter sessions, and lower turnover per visit all point to fading commitment. This matters most for casino-heavy operators, where high-value players tend to dial back their exposure well before they leave for good.
Game Variety Narrows
Engaged players tend to explore; at-risk players shrink down to a single game. When someone who once moved between the sportsbook and live casino now only spins one slot, their connection to the platform is thinning, and that narrowing is easy to catch in the data if you're watching for it.
Campaign Response Decays
Marketing engagement is often the first visible crack. Falling email open rates, ignored push notifications, and unused bonuses all point to weakening brand affinity. Feed this into your churn model rather than parking it in a separate campaign report where it never informs retention.
Bonus Dependency Rises
Not every active session is a healthy one. A player who only shows up when you hand them an incentive is fragile and expensive to keep. Track the ratio of organic play to bonus-driven play; once the organic side dries up and only bonus-triggered sessions remain, retention is already on thin ice.
VIP Cooling
High-value players almost never vanish overnight. They cool off gradually, with smaller stakes, fewer sessions, less appetite for premium games, and slower replies to their host. A dedicated VIP cooling score protects the accounts that matter most, since these are the losses that sting the hardest.
Friction and Frustration Signals
Sometimes the platform itself is doing the pushing. Failed deposits, slow KYC checks, repeated errors, and rage clicks drive players away in a way no bonus can repair. These signals also overlap with responsible-gaming monitoring, so watching them supports both retention and compliance at once.
The Player Churn Detection Framework: From Signal to Action
Detection isn't about staring at one metric. It's about pulling the signals together into a single risk view, then doing something with it. Three steps turn scattered data points into something your team can act on.
Step 1: Collect the Right Data
Bring behavioral, transactional, and communication data into one place: logins, session length, bet size, deposit timing, game choices, bonus use, and email or push response. Clean, connected data is the whole foundation, and solid casino game analytics make this far easier to scale.
Step 2: Build a Churn-Risk Score
One signal is useful; several signals stacked together are powerful. Blend the eight behaviors into a single churn-probability score per player, weighted so the score climbs sharply when multiple signals line up.
Step 3: Set Thresholds and Triggers
A score only earns its keep when it triggers something. Define the thresholds that move a player into an at-risk segment, then wire that segment to an automatic workflow. Each signal maps to a measurable input:
| Signal | What to measure | Why it's an early flag |
|---|---|---|
| Login frequency | Active days vs personal baseline | Falls before deposits do |
| Deposit gap | Days between deposits | A lengthening gap signals habit erosion |
| Session value | Bet size and session length | Reveals fading commitment |
| Game variety | Number of games or verticals played | Narrowing points to lower immersion |
| Campaign response | Open, click, and bonus-use rates | First visible sign of detachment |
| Bonus dependency | Organic vs incentivized play | Fragile, costly engagement |
| VIP cooling | Stake size, session count, host response | Protects your highest-value accounts |
| Friction signals | Failed deposits, KYC delays, errors, rage clicks | Churn no offer can fix |
Spot At-Risk Players While They're Still Reachable
SDLC Corp builds churn scoring and automated retention workflows into your iGaming platform, so fading players are flagged and re-engaged before they go quiet.
Get a Churn AuditHow Does Churn Prediction Work?
Churn prediction watches these signals across your entire player base and flags who's drifting before they go dark. The model learns each player's normal rhythm, measures how far current behavior strays from it, assigns a churn-probability score, and raises an alert the moment a player crosses a threshold.
The Models Behind Churn Prediction
The methods are practical rather than purely academic. Many operators lean on predictive analytics in casino apps to do the heavy lifting. Published studies report random forest models reaching accuracy in the high 80s for player-behavior prediction, reliable enough to drive daily operational decisions, not just research papers.
Build vs Buy: Do You Need Custom Machine Learning?
Not at the start. For most operators, CRM-native churn scoring is plenty to begin spotting at-risk players and firing off campaigns. Custom machine learning earns its place later, once your data volume, player base, and team maturity justify the build. Start simple, prove the value, then scale the model.
Real-Time vs Batch Detection
Batch detection runs daily or weekly and covers most retention campaigns comfortably. Real-time detection reacts within minutes and matters most for friction signals, like a failed deposit or a frustrated VIP mid-session, where an instant response can save the player on the spot. The strongest setups run both side by side.
What to Do When You Spot an At-Risk Player

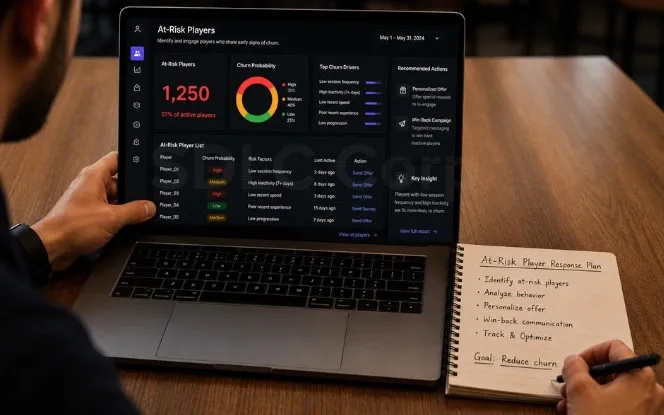
Here, speed beats spend. A fast, personal response recovers more players than a larger bonus does. Once your system flags someone, three moves consistently work best.
Reach Out Fast on the Right Channel
How quickly you respond matters more than how generous the offer is. Use the channel that suits the moment. Well-timed push notifications often outperform email for time-sensitive nudges like an expiring offer or a live event kicking off.
Personalize the Offer
Match the offer to the player's favorite games and usual stake. AI-driven personalization lifts response rates well past generic bonuses, because a relevant nudge reads like a genuine reason to come back rather than spam.
Fix the Friction
If the signal is friction, no offer will save it. Sort out slow withdrawals, clunky KYC, and bonus bugs first, because these quietly bleed lifetime value and nudge your best players toward the competition.
Turn Detection Into an Automated Workflow
Detection should set off a predefined workflow, not a manual scramble. Connect your at-risk segment to automated campaigns and tie it into your loyalty programs so re-engagement fires the instant a threshold is crossed. The faster the response, the higher the recovery rate.
Common Churn Detection Mistakes to Avoid
A handful of habits quietly blunt detection. Clear these and your model sharpens up fast.
A 30-day inactivity flag confirms churn, it doesn't predict it.
A player's own baseline is the only fair comparison.
Lone signals miss context; combined scores catch real risk.
A casual player and a VIP need different thresholds and different responses.
A score with no workflow behind it changes nothing.
For what works once detection is in place, see our guide to player retention best practices.
How SDLC Corp Helps You Detect Player Churn Early
SDLC Corp builds iGaming platforms and CRM systems that turn raw player behavior into early alerts. The idea is simple: catch the signals while a player is still active, then trigger the right outreach automatically.
In our operator engagements, churn-risk scoring built on these behavioral signals flags at-risk players days before a last-login report would, giving retention teams time to act while players are still active and reachable, which is exactly when recovery rates are highest.
You get churn scoring, behavioral segmentation, and multi-channel campaigns in one connected workflow, so at-risk players land on a retention path before they ever go quiet. The same platform handles loyalty, personalization, and reporting too, which keeps detection and action together instead of scattered across half a dozen tools.
Conclusion
Churn is never sudden. Players drift for weeks before they stop depositing, logging in less, spacing out deposits, ignoring offers. The operators who keep them read those early signals and act while the player is still reachable.
That's the shift: from reacting to detecting. Watch the eight signals, blend them into a churn-risk score, set thresholds, and trigger an automatic response. You don't need a data science team to start. CRM-native scoring works today, with machine learning added as you grow.
See how SDLC Corp helps you flag at-risk players before they go quiet.
Our team builds churn scoring, behavioral segmentation, and automated retention campaigns into one iGaming CRM. Spot at-risk players early and win them back before they ever leave.
Talk to a Retention ExpertFrequently Asked Questions
How is player churn rate calculated?
Divide the players lost during a period by the players you started with. Lose 200 of 2,000 players in a month and that's a 10% monthly churn rate. Track it by cohort and by player value for a clearer read.
What is a good player retention rate in iGaming?
It shifts by market and vertical, but strong operators keep monthly churn under 5% and watch Day 7 and Day 30 retention rather than Day 1 alone. Measure yourself against your own past cohorts, not a single global benchmark.
How early can you detect churn?
Behavioral signals like falling logins can show up 7 to 14 days before a player stops depositing. That window is your chance to act while they're still reachable.
Is deposit timing or deposit value more predictive?
Timing usually wins. A widening gap between deposits points to habit erosion even when the amount holds steady, and broken habits are among the earliest churn indicators.
What's the difference between churn detection and churn prevention?
Detection identifies who's about to leave. Prevention is what you do next: outreach, offers, or fixing friction. You need both, and detection always comes first.
Can small operators detect churn without a data science team?
Yes. CRM-native churn scoring lets smaller operators spot at-risk players and run automated campaigns with no custom models at all. You can layer machine learning on later as you grow.


