Pipeline observability is the ability to tell, without being told by a stakeholder, that data arrived late, arrived incomplete, changed shape, or never arrived.
Data incidents are often discovered outside the data team. Somebody recognises that a number is wrong, a day or two after the pipeline that produced it ran successfully. The pipeline reported success because it did what it was told. Nothing checked whether the result made sense.
Orchestration reports that a task exited cleanly. Infrastructure monitoring reports that the cluster stayed up. Neither reports that a source stopped sending half its rows, or that a column changed type and now coerces to null.
- A successful run is not evidence of correct data; instrument outputs, not just exit codes.
- Freshness, volume, completeness and schema cover a large share of real incidents.
- Set thresholds from observed history per dataset, not from one global rule.
- An alert without an owner and a first action is noise that trains people to ignore alerts.
- Lineage turns a symptom in a dashboard into a specific upstream task to inspect.
A Worked Example: The Region That Stopped Reporting
The same retailer runs through this article. Meridian Retail loads about 4 million orders a month from 12 marketplace regions into a warehouse. A finance mart and a merchandising dashboard read from it. The nightly window runs 01:00 to 03:00.
Region 7 accounts for roughly 6 percent of order volume. Its nightly CSV export broke after a partner-side change. The file still arrived. It contained only headers.
- What the job reported Success. The load task read the file, found zero data rows, wrote nothing and exited cleanly.
- What the volume check did Nothing. Total orders fell about 6 percent, inside a 10 percent tolerance set against recent history.
- What caught it A per-region presence check at 02:10. Region 7 had zero rows for the first time in its history.
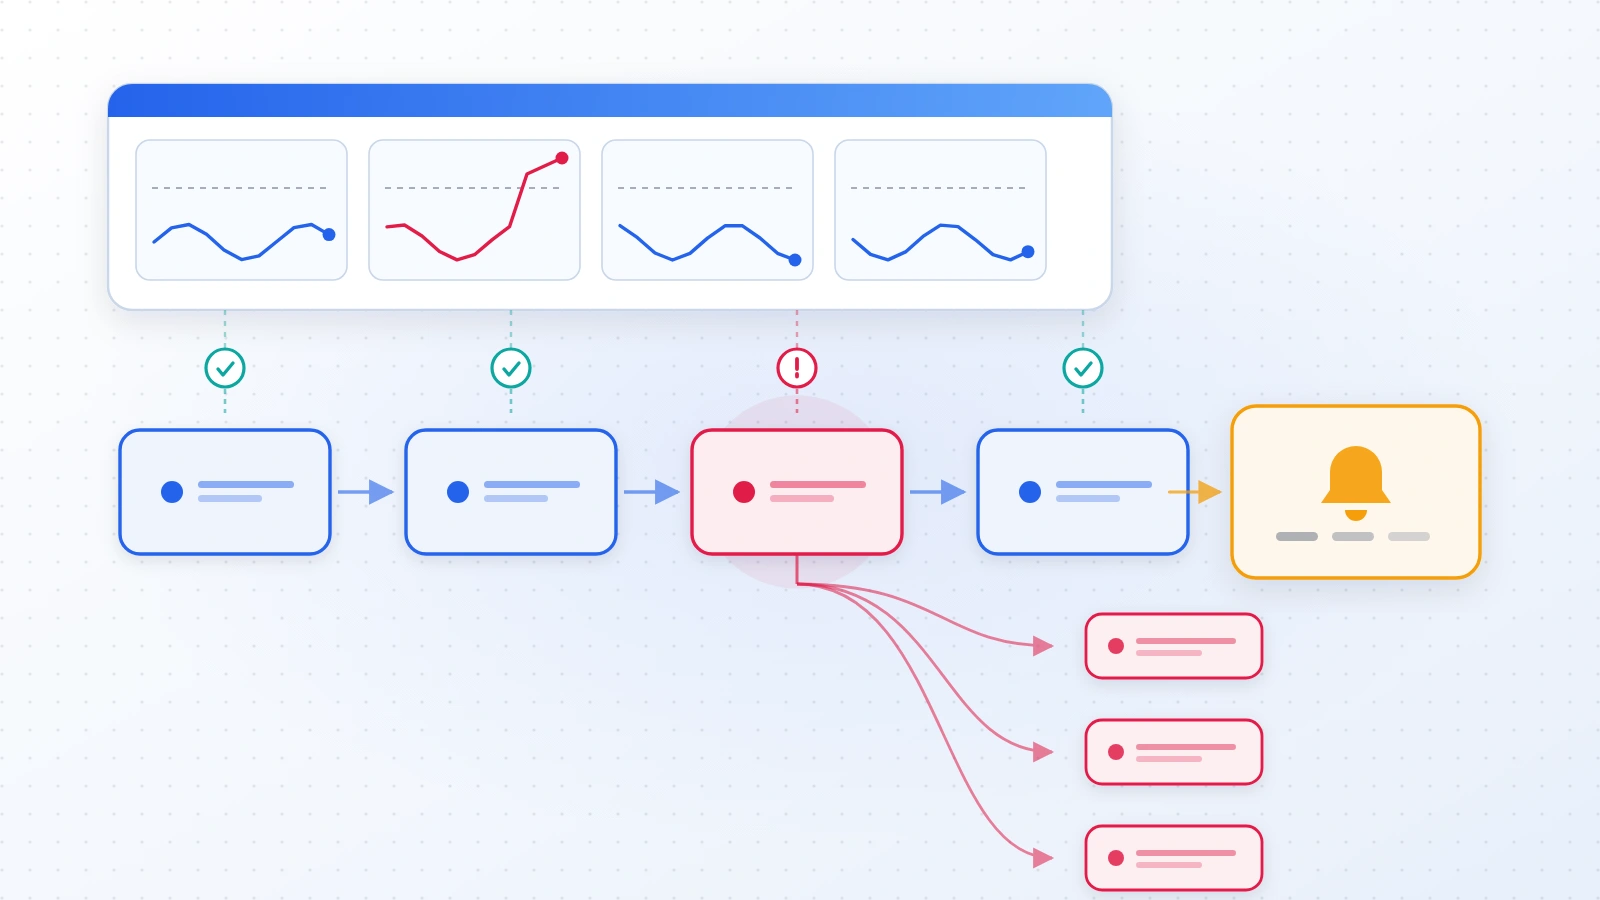
- What lineage showed The finance mart and two dashboard models consumed region 7. All three were flagged stale rather than wrong.
- How it was corrected A three-day backfill once the partner fixed the export, reconciled against the payments provider's settlement file.
Three signals were in place and only one fired. The volume check was correctly configured and still missed it, because a small segment inside a healthy total is exactly what volume checks cannot see.
A clean exit code, a passing volume check, and wrong data, all at the same time.
What Pipeline Observability Covers
Three layers get conflated. Each answers a different question, and each misses what the others catch.
- Infrastructure monitoring Is the platform healthy? CPU, memory, disk, cluster nodes, network. Catches outages, misses wrong data from a healthy system.
- Pipeline monitoring Did the job run and finish? Exit status, duration, retries, dependency state. Catches failures, misses a clean run over bad input.
- Data observability Is the output trustworthy? Freshness, volume, completeness, schema, distribution. Catches what the other two report as success.
The third layer is the one estates most often lack. Its absence has a signature: dashboards are green, uptime is excellent, and problems still reach the data team from the business.
Observability does not define correctness. It detects change and deviation. Deciding that a customer identifier must never be null, or that revenue must reconcile to the ledger, is data quality work. Observability reports that a rule you already hold has started being violated.
Infrastructure and job monitoring both report success on a run that produced wrong data.
Freshness: The First Signal to Instrument
Freshness is the age of the most recent data relative to now. It is usually the first check worth adding, because many failure modes eventually appear as data that stopped arriving.
Measure it at the output, not at the job. A task can succeed while writing nothing, as Meridian's region 7 load did. A scheduler that never fired produces no failure event at all. Checking the maximum event timestamp catches both, because it asks about the artefact rather than the process.
Set the threshold from the dataset's own history. A table loaded hourly and a table loaded monthly have nothing useful in common. One platform-wide threshold either floods the hourly table with noise or lets the monthly one go stale for weeks.
Account for seasonality before treating a gap as an incident. Batch feeds that run only on business days look stale every weekend. A check that cannot express that gets muted.
- Track the maximum event timestamp and the last successful write time separately.
- Derive thresholds per dataset from observed arrival history.
- Encode business calendars so weekends and holidays do not generate predictable false alarms.
- Alert on absence explicitly, because a job that never started emits no failure of its own.
Check the age of the data, not the status of the job meant to refresh it.
Completeness, Volume and Distribution Anomalies
The next class of failure is data that arrives on time but is not all there. Row counts that drop by a third. A partner feed missing a region. A join that started dropping records after an upstream key change.
Volume checks compare the current load against recent history for the same slot. Most pipelines have a strong weekly shape. Comparing Monday to Sunday produces noise; comparing this Monday to recent Mondays produces signal.
Completeness is narrower and catches more. Null rates in columns that should never be null. Referential checks against a dimension. Presence of every expected partition or segment.
Meridian's incident is the case for completeness. Region 7 is 6 percent of volume, well inside the 10 percent tolerance. A per-region presence check found it on the first night.
Distribution checks sit at the edge of this discipline. Watching a numeric range or a categorical cardinality catches genuine corruption. It also fires on real business change, so it belongs on a few high-value columns rather than everywhere.
Core observability signals, what each one detects, and how it is typically measured
| Signal | Catches | Measured as | Common failure it misses |
|---|---|---|---|
| Freshness | Feed stopped, job never ran, silent empty write | Age of latest record vs expected cadence | Data that is current but wrong |
| Volume | Partial loads, duplicated loads, truncation | Row count vs same slot in recent history | Small segments inside a stable total |
| Completeness | Missing segments, unexpected nulls, broken joins | Null rates, per-partition presence, referential checks | Values present but incorrect |
| Schema | Type changes, dropped or renamed columns | Comparison against the registered contract | Same schema, changed semantics |
| Latency | Slow sources, queue backlogs, missed windows | End-to-end time from event to availability | Fast delivery of incomplete data |
| Job state | Crashes, timeouts, dependency blocks | Orchestrator run status and duration | Clean runs over bad input |
Volume catches the big drops. Per-segment completeness catches the ones that hide.
Schema Drift and Contract Breaks
Schema drift is an upstream team changing the shape of data without telling anyone downstream. It is rarely malicious and usually invisible until something breaks.
The damaging cases are quiet. A dropped column fails loudly and gets fixed. A column whose type widens from integer to string passes structural checks and corrupts results until totals move.
Detection needs a registered expectation. Capture the schema you depend on, check each load against it, and classify the difference. Additive changes are usually safe to accept and log. Type changes, removals and renames should block.
The organisational half matters more. A schema check tells you the contract broke. It does not tell the upstream team they broke it. Contracts hold when the producing team knows which fields have consumers.
Where the check sits depends on the transformation model. Pre-load transformation gives one gate before anything lands. In-platform transformation means the raw zone accepts whatever arrives, so checks live between model layers. That difference is set out in ETL vs ELT for enterprise data pipelines.
Accept and log additive change. Block type changes, renames and removals.
Latency, SLAs and Service Level Objectives
Latency is meaningful only against a decision window. Four-hour-old data is irrelevant for a monthly report and unacceptable for an inventory check.
Express it as an objective on the dataset, not a target on the job. A service level objective states that data will be no older than a stated age for a stated percentage of the time, over a window. Google's SRE book sets out that structure, including the error budget that follows from it: see the chapter on service level objectives.
Measure end to end, from the event occurring in the source to it being queryable. Per-stage timings help diagnosis. The number a consumer experiences is the sum, including the queueing between stages that per-stage metrics hide.
Tier the objectives. Meridian sets 02:30 for the finance mart, because close depends on it, and 08:00 for the merchandising dashboard. One blanket target would either over-engineer the dashboard or under-protect the mart.
Latency targets by decision window are set out in real-time data architecture.
Objectives belong to datasets and decision windows, not to jobs, and should be tiered.
Job Failures, Dependency Failures and Retries
Not every failure deserves the same response. Treating them uniformly is how teams retry into a broken source, or page somebody for a transient network blip.
A transient error is worth retrying with backoff. A late input is worth waiting for, then escalating. A contract violation should stop immediately, because retrying produces the same wrong answer faster. Resource exhaustion needs a different fix and will recur until capacity changes.
Retry behaviour is itself a signal. A task that succeeds on the third attempt every night is not healthy. It is failing twice nightly behind a retry policy. Tracking retry counts over time surfaces that degradation before it becomes an outage.
Dependency failures need the blast radius, not just the failed node. When a task fails, the question is which downstream outputs are now stale or partly built. Answering it quickly is a property of how the dependency graph is modelled, which is covered in data orchestration for modern data platforms.
- Classify failures as transient, late-input or contract violations, with a distinct response for each.
- Track retry counts as a health signal, not just as a recovery mechanism.
- Record which downstream datasets each failure left stale, before starting the fix.
- Stop immediately on contract violations rather than retrying a deterministic error.
A task that always succeeds on retry is failing quietly and should be treated as degraded.
Validating Backfills and Recovery
Recovery is where observability earns its keep. A backfill is a large write over historical data, and a bad one is harder to detect than the incident that prompted it.
Validate before, during and after. Before: know which partitions are affected and what the current values are. During: watch that the rebuild produces plausible volumes per partition, rather than uniform counts suggesting a parameterisation bug. After: reconcile against an independent source.
Meridian reconciled its region 7 rebuild against the payments provider's settlement file. That source sat outside the broken path, which is what made the comparison meaningful.
Suppress alerts deliberately during a backfill, and time-box the suppression. Freshness and volume checks fire while history is rewritten. A team that silences them without an expiry often forgets to re-enable them, and a monitored pipeline quietly becomes an unmonitored one.
Attach the incident record to the affected datasets, not only the job. Six months later the useful question is which periods of this table were rebuilt and why.
The same reconciliation discipline applies when old and new pipelines run side by side during a migration, a pattern covered in legacy data pipeline modernization.
Time-box alert suppression, and reconcile against a source outside the broken path.
Logs, Metrics, Traces and Lineage
Three conventional telemetry signals apply to pipelines. OpenTelemetry defines them as traces, metrics and logs: see the OpenTelemetry signals overview. A fourth is specific to data and does most of the diagnostic work.
Metrics, logs and traces
Metrics carry the signals above as time series, which is what makes thresholds and trends possible. Logs carry the detail needed once a metric shows where to look. They help only if structured enough to filter by pipeline, run and partition.
Traces are the least used and often the most valuable for latency work. Propagating a run identifier through every stage turns a vague complaint into a specific answer about which stage consumed the time, including the waiting between stages.
Lineage-assisted diagnosis
Lineage converts a symptom into a location. When a dashboard number looks wrong, lineage names the models feeding it, the tables feeding those, and the ingestion task that last wrote to them.
It also works in reverse, which matters more during an incident. Given a failed upstream task, lineage identifies every downstream dataset and consumer affected. Meridian used it to flag the finance mart and two dashboard models within minutes, rather than waiting for someone to complain.
Column-level lineage is materially better than table-level here, because most disputes concern one figure rather than a whole table.
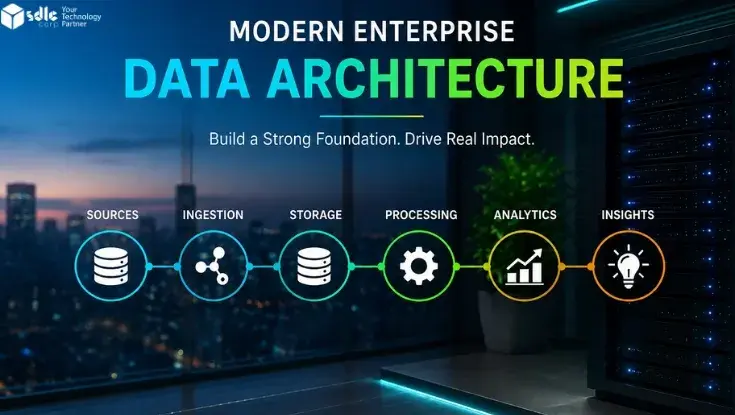
Where the platform's lineage and control planes sit is an architecture question, covered in modern enterprise data architecture.
Metrics say something changed. Lineage says where, and who is downstream of it.
Alerting People Actually Trust
The failure mode of observability programmes is not missing checks. It is too many alerts, which produces the same outcome as having none.
Route by consequence. A dataset feeding a regulatory return and one feeding an internal experiment should not share a channel. Only the first justifies waking someone. Most checks should raise a ticket for working hours.
Alert on symptoms consumers would notice, not on every intermediate step. One alert saying a published dataset is stale beats fifteen saying individual upstream tasks failed. Grouping by root cause is what keeps one outage from producing a hundred notifications.
Every alert needs three things before it exists: a named owner, a first diagnostic step, and a defined action if the check is wrong. An alert that cannot be acted on or tuned gets muted, and a muted check looks like coverage without being it.
- Tier alerts by business consequence, and reserve paging for a small minority.
- Group by root cause so one upstream failure produces one notification.
- Require an owner, a first step and a tuning path before a check goes live.
- Review firing rates regularly and retire checks that never lead to action.
An alert nobody can act on will be muted, and a muted check is worse than an absent one.
Incident Response, Ownership and Escalation
Data incidents differ from application incidents in one way. The damage is usually already distributed before anyone notices. Wrong numbers have been read, exported and acted on. Response includes correcting the record, not only restoring the pipeline.
A workable sequence is contain, communicate, correct, review. Contain by stopping dependent pipelines. Communicate to identified consumers, using lineage rather than guesswork. Correct through a validated backfill. Review whether an existing check should have caught it sooner.
Meridian's review produced one change: a per-segment presence check on every partner feed, not only the region files. Two other feeds had the same blind spot.
Communication is the step teams skip and regret. Telling consumers that a dataset is known to be wrong preserves trust. Letting them find out independently costs more than the original fault.
Record ownership per dataset, with an escalation path. Shared ownership of a critical pipeline reliably means nobody owns it at the moment it breaks.
Contain, communicate, correct, review. Communicating is what protects trust.
Observability for Batch and Streaming
The signals stay the same. The mechanics differ, and applying batch instincts to a stream produces checks that never fire usefully.
Batch pipelines have discrete runs, so a check can evaluate after each one. Streaming pipelines have no run boundary, so the same questions are asked continuously over windows. Freshness becomes consumer lag rather than the age of the last load.
How the same observability questions are answered for batch and streaming pipelines
| Question | Batch | Streaming |
|---|---|---|
| Is data current? | Age of the latest partition after each run | Consumer lag and event-time watermark delay |
| Is anything missing? | Row counts per partition against history | Throughput per window, plus dead letter queue depth |
| Did processing fail? | Run exit status from the orchestrator | Processor restarts, checkpoint age, state store health |
| How late is it? | Time from window close to availability | Event time to action time, tracked per percentile |
| What about duplicates? | Partition-level reconciliation | Operation keys and idempotency checks |
| How is recovery verified? | Backfill reconciled against an independent source | Replay from the log, compared against original output |
Dead letter queues deserve a check of their own. They hold malformed and unprocessable events, they grow silently, and an unwatched one is a running record of data the business believes it has.
Streaming replaces run-boundary checks with continuous windows, lag and dead letter depth.
Frequently Asked Questions
How Is Pipeline Observability Different From Infrastructure Monitoring?
Infrastructure monitoring answers whether the platform is healthy. Pipeline observability answers whether the output is trustworthy. A cluster can be entirely healthy while a feed silently stops sending half its rows, and only the second layer notices.
Which Signals Should A Team Instrument First?
Freshness, then volume, then completeness, then schema. Freshness catches a large share of real incidents, because many failure modes eventually appear as data that stopped arriving, and it is usually the cheapest check to implement.
Why Did A Volume Check Miss A Missing Region?
Because a small segment inside a healthy total does not move the total enough. A region worth 6 percent of volume falls inside a 10 percent tolerance. Per-segment presence checks catch this class of failure; aggregate volume checks structurally cannot.
How Should Alert Thresholds Be Set?
From each dataset's observed history rather than a global default, with business calendars encoded so weekends and holidays do not produce predictable false alarms. A single platform-wide threshold either floods frequent pipelines with noise or lets infrequent ones go stale unnoticed.
Does Observability Replace Data Quality Rules?
No. Observability detects change and deviation; data quality defines what correct means. Observability reports that a rule you already hold has started being violated, but it cannot decide which rules matter for your business.
How Should Backfills Be Monitored?
Suppress freshness and volume alerts deliberately and with a time limit. Watch per-partition volumes during the rebuild for signs of a parameterisation bug. Reconcile the rebuilt range afterwards against a source that was not part of the broken path.
What Changes For Streaming Pipelines?
The signals are the same but there is no run boundary. Freshness becomes consumer lag and watermark delay, volume becomes throughput per window, and dead letter queue depth becomes a first-class check, since unprocessable events accumulate there silently.