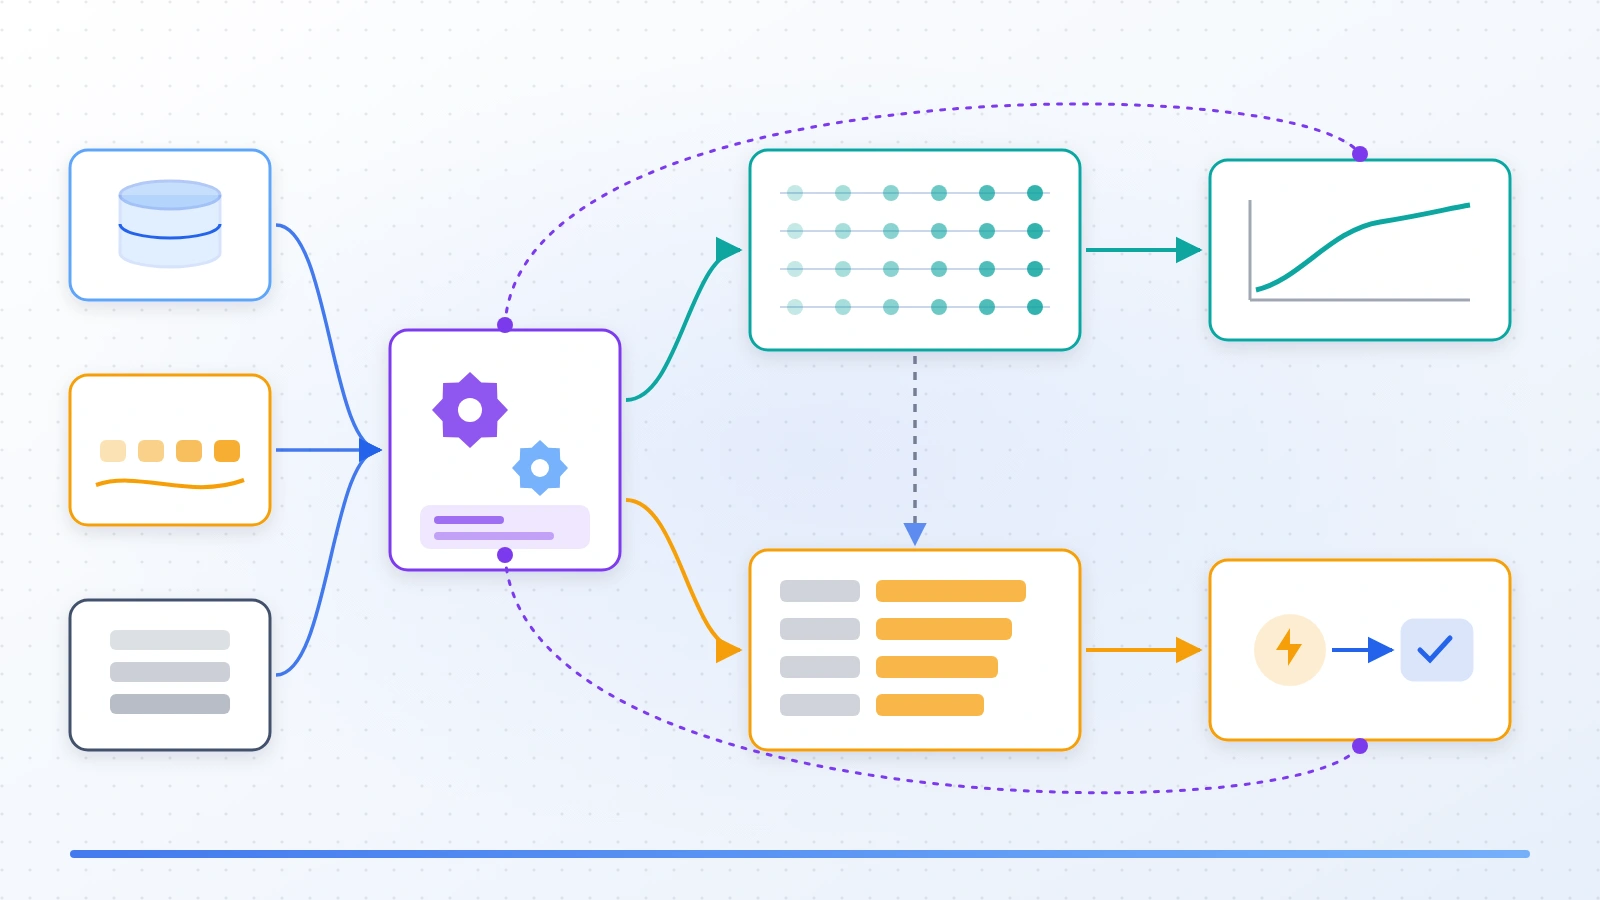
AI observability is the ability to explain what a production AI system is doing and why. It shows which components a request touched, which versions were involved, what it cost, and where it slowed down or failed.
A production AI system is rarely one model. A single answer can pass through a gateway, a prompt template, a retriever and a vector store. It may call one or more model providers and several business systems. Behind all of it sit the data pipelines that keep those components current.
When something goes wrong, the symptom appears at the end of that chain. A user sees a slow or wrong answer. Observability is what lets the team trace that symptom back to the component, version or dependency that caused it.
- Model monitoring asks whether the model still performs. Observability explains the whole system.
- Every request needs one correlation ID that follows it through every component.
- Record prompt, retriever, index and model versions on every trace, not just in release notes.
- Treat cost, latency and provider health as first-class signals, alongside errors.
- Tie technical telemetry to business outcomes, or incidents get prioritised by volume, not impact.
A Worked Example: The Assistant That Slowed Down
Meridian Retail runs a customer-support assistant. It answers policy questions from a retrieval index of policy documents. It looks up orders through a tool call to the order system, and it generates replies through a hosted model provider.
On a Monday morning, two complaints arrived together. Answers about return windows cited an outdated policy, and p95 response time had risen from about 2 seconds to over 6.
- Model monitoring Flagged a drop in groundedness scores. It could say answers were getting worse, not why.
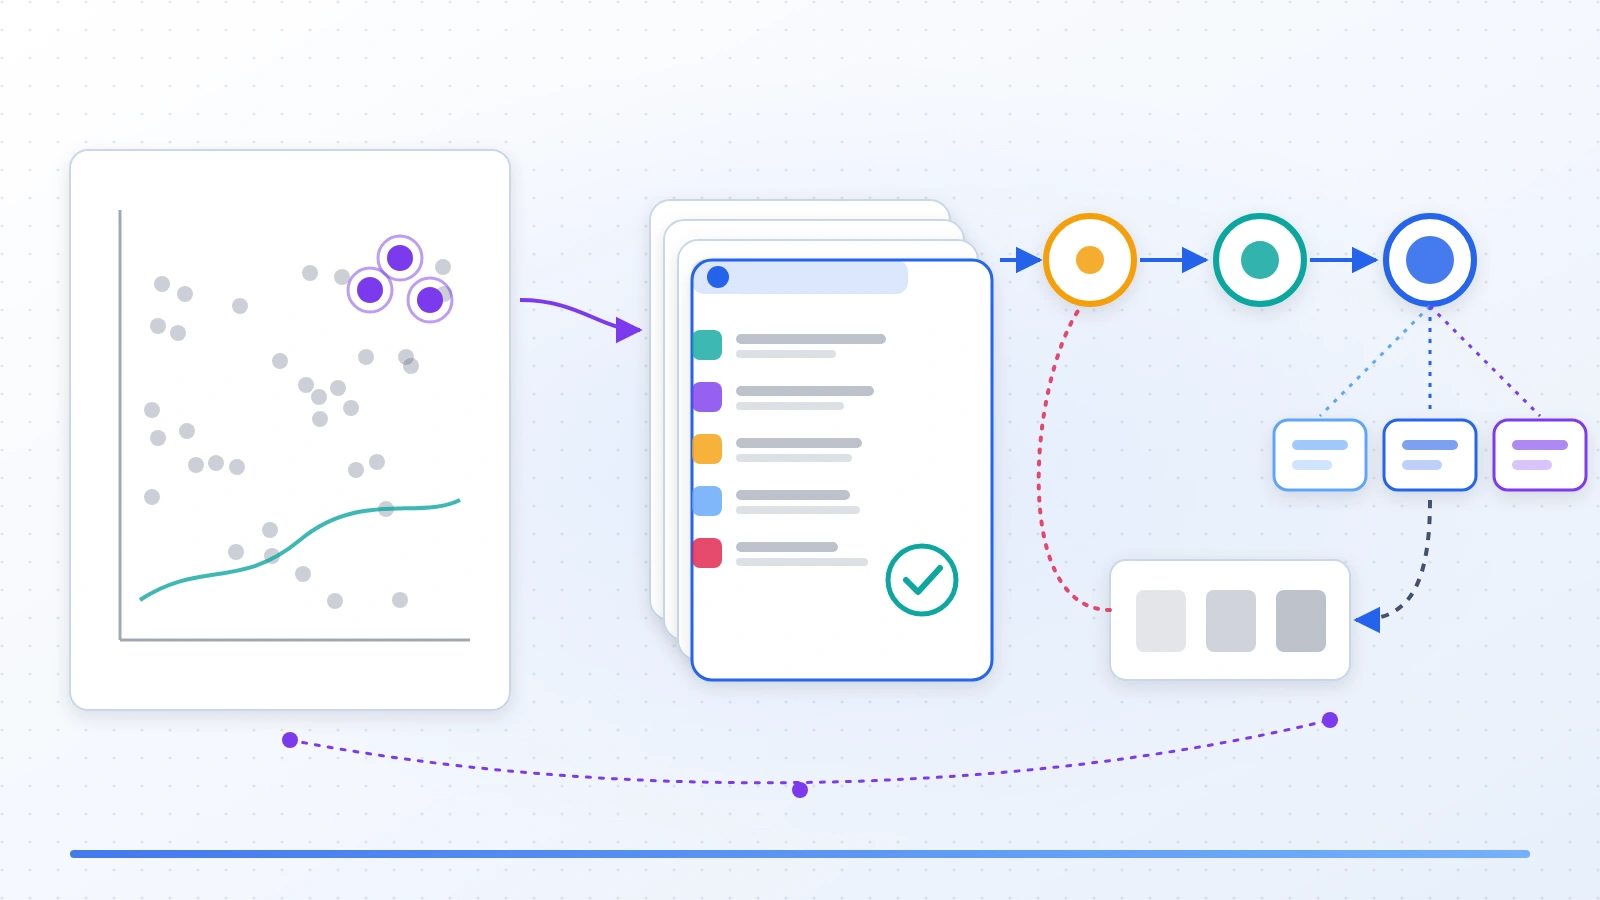
- Traces Showed the retrieval span returning documents from an archived policy folder, and the generation span consuming far more input tokens.
- Version correlation Every affected trace carried the same index version, built overnight, and a prompt template changed on Friday.
- Pipeline health The overnight index job had succeeded. A source filter excluding archived folders had been dropped in a refactor.
- Provider health Larger prompts pushed the account over its rate limit. Retries after 429 responses explained most of the added latency.
- Resolution The index was rolled back, the filter restored with a test, and the context size capped. Latency and answer quality recovered the same day.
No single dashboard held the answer. It came from following one correlation ID across the gateway, retriever, index build, prompt version and provider calls.
Monitoring reported the symptom. Observability connected it to a pipeline change and a prompt change.
What AI Observability Means
Observability comes from control theory. A system is observable when its internal state can be inferred from its outputs. In software, that means emitting enough telemetry that new questions can be answered without shipping new code.
For AI systems, the questions are specific. Which retrieval results fed this answer? Which prompt version produced it? Which provider served it, how long did each step take, and what did it cost? Would the same request have behaved differently yesterday?
- Every request can be traced end to end across services and providers.
- Every trace records the versions of models, prompts, indexes and configuration involved.
- Latency, error rate, token use and cost are measured per component, not only in total.
- Upstream data pipelines report health that can be joined to downstream AI behaviour.
- Technical signals can be tied to the business outcome each request was meant to serve.
AI Observability vs Model Monitoring
The two are complementary. Model monitoring asks whether the model is still performing correctly. Observability explains what is happening across the entire production system, and why.
How the two disciplines divide the work.
| Aspect | Model monitoring | AI observability |
|---|---|---|
| Core question | Is the model still performing correctly? | What is the system doing, and why? |
| Scope | Model inputs, outputs and quality | Every component a request touches |
| Typical signals | Drift, accuracy, bias, groundedness | Traces, logs, metrics, versions, cost |
| Typical output | An alert that quality has changed | The component and change that caused it |
| Main users | Model owners, data scientists | Platform, SRE and application teams |
Drift detection, fairness monitoring, hallucination scoring and quality thresholds belong to model monitoring, and are set out in AI model monitoring in production. This article covers the system-level telemetry that makes those alerts diagnosable.
Logs, Metrics and Traces
The three classic signals still apply. What changes for AI is what each one needs to carry.
- Metrics Aggregated numbers over time: request rate, error rate, latency percentiles, tokens per request, cost per request, cache hit rate and queue depth.
- Logs Discrete records of what happened: provider errors, tool-call failures, guardrail blocks and configuration loads. Structured, with the correlation ID on every line.
- Traces The path of one request through every component, as nested spans with timings and attributes. The signal that connects the other two.
Prompt and response content needs deliberate handling. It is valuable for debugging and sensitive for privacy. Log references or redacted versions by default, and keep full content only where retention and access are controlled.
OpenTelemetry describes a trace as the path of a request through an application, built from spans that carry attributes and events. Using an open standard keeps telemetry portable across vendors and model providers.
The AI Dependency Map
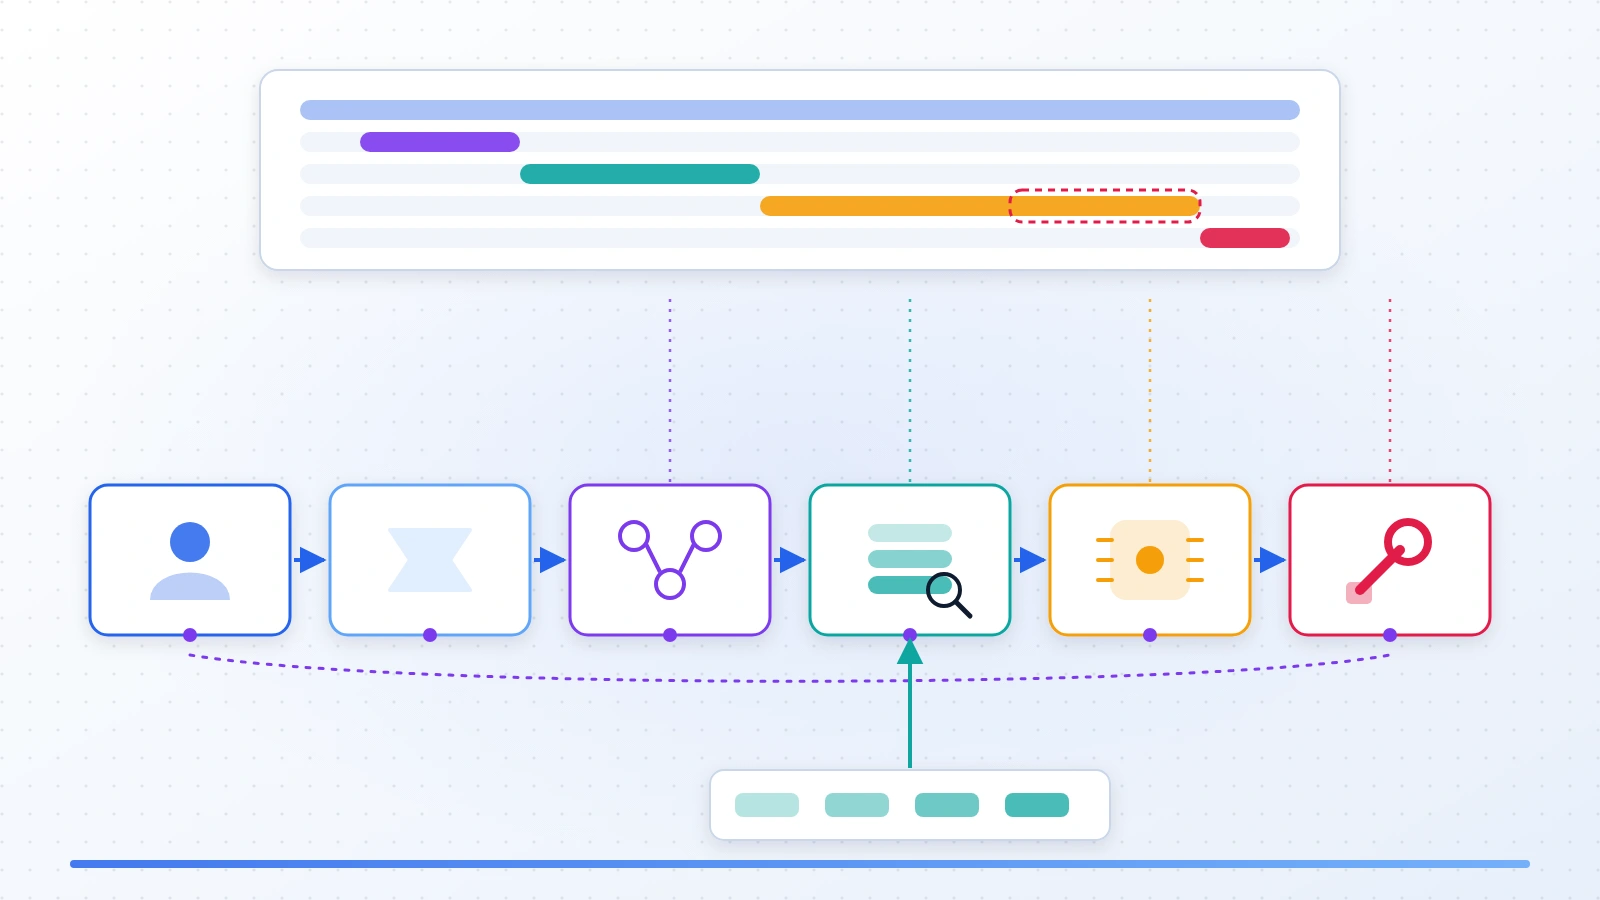
Observability starts with knowing what a request can touch. A dependency map lists every component on the path, its owner and the signals it emits.
- Entry points: gateways, APIs, chat interfaces and batch jobs.
- Orchestration: prompt templates, routing logic, agent frameworks and guardrails.
- Retrieval: embedding models, vector stores, search indexes and rerankers.
- Models: hosted providers, self-hosted models and fallback routes.
- Tools: internal APIs and business systems the AI can call.
- Data: the pipelines that build indexes, features and reference data.
Gaps in the map become blind spots in incidents. Meridian's index build job was not on the assistant's map, so its failure looked like a model problem until someone thought to check.
Keep the map in version control next to the code, and review it when a new dependency is added. A map maintained in a slide deck is out of date by the second incident.
Classic ML services belong on the same map. A fraud or pricing model served behind an API has its own dependencies: the feature lookups it performs, the model server that hosts it and the fallback rules used when it times out. Instrument them with the same trace context, so a slow checkout can be traced into the feature store as easily as into an LLM call.
LLM and Provider Observability
Hosted model providers are external dependencies with their own failure modes. They need the same scrutiny as any third-party API, plus signals specific to language models.
- Latency split into time to first token and total generation time.
- Input and output token counts per request and per feature.
- Rate-limit responses, retries and timeouts per provider and model.
- Fallback activations when a primary model is unavailable.
- Model identifier and provider version on every generation span.
Provider behaviour can change without any change on your side. Recording the model identifier per request is the only reliable way to tell a provider update from a regression in your own code. The wider operational differences between classic ML and LLM systems are covered in MLOps vs LLMOps.
Guardrails need the same treatment. Record every input or output block, the rule that fired and the configuration version. A sudden rise in blocks can signal an attack, a prompt defect or an over-tightened rule, and only the trace context tells them apart.
RAG Observability
Retrieval-augmented systems add a component that can fail quietly. A retriever that returns the wrong documents still returns something, and the model will still write a fluent answer.
- Retrieval latency and result counts per query.
- Document identifiers and scores returned, recorded on the retrieval span.
- Index version and last successful build time.
- Empty-result and low-score rates over time.
- Context size passed to the model after retrieval and truncation.
Observability records what was retrieved. Judging whether it was relevant and whether the answer was grounded in it is an evaluation task, covered in how to evaluate RAG systems.
Agent Observability
Agents make multi-step decisions: which tool to call, with which arguments, and whether to continue. Each step is a place where behaviour can go wrong, and the path differs per request.
- Step tracing Record each reasoning or planning step, tool selection and tool result as a child span of the request.
- Tool-call health Latency, error rate and argument validation failures per tool.
- Loop and budget limits Step counts, token budgets and time limits, with an event when an agent hits one.
- Side effects An auditable record of every action an agent took in a business system.
Side effects deserve particular care. An agent that updates an order or issues a refund needs the same audit trail as a human user performing the same action.
Agent traces vary in shape from one request to the next. Dashboards built on fixed step names break quickly. Aggregate by tool and by outcome instead, and use trace search for the path itself.
Data Pipeline Health
AI systems inherit every defect in the data that feeds them. Indexes, features and reference tables are built by pipelines, and a pipeline that runs successfully can still deliver the wrong data.
The freshness, volume, schema and completeness checks described in data pipeline monitoring and observability apply directly. What AI observability adds is the join: linking the pipeline run that built an index to the requests that used it.
- Record the pipeline run ID and build time on every index and feature version.
- Propagate that version onto the retrieval or feature-lookup span.
- Alert on AI behaviour changes that coincide with a new data version.
Latency, Cost and Capacity
AI requests are slower and more expensive than typical API calls, and both vary per request. Averages hide the requests that matter.
Signals for performance and spend.
| Signal | What to measure | Why it matters |
|---|---|---|
| Latency | p50, p95 and p99 per component and end to end | Tail latency is what users notice |
| Token use | Input and output tokens per request and feature | The main driver of LLM cost |
| Cost | Cost per request, per feature and per tenant | Links spend to business value |
| Capacity | GPU utilisation, memory, queue depth and concurrency | Self-hosted models saturate before they fail |
| Caching | Hit rate for prompts, embeddings and responses | A cheap lever on both latency and cost |
Break latency down per span. Meridian's end-to-end number rose, but the trace showed generation and provider retries, not retrieval, were responsible.
Attribute cost at request level, with tenant and feature tags. Monthly provider invoices show the total but not which feature, customer or prompt change produced it. Request-level attribution makes a cost spike as diagnosable as a latency spike.
Batch AI workloads need a different view. For document processing or nightly scoring, the useful measures are throughput, completion inside the window and cost per item, rather than per-request latency.
Version and Configuration Tracking
AI behaviour changes when any of several versions change, often independently. Release notes are not enough. The versions must travel with each request.
- Model identifier and provider version.
- Prompt template version and system-prompt hash.
- Retriever, embedding model and index version.
- Guardrail and routing configuration version.
- Application release and feature flags.
With versions on every trace, a regression can be sliced by version rather than by time. That turns a question such as 'what changed on Friday?' into a query.
Model releases should write the same metadata at deployment time, as described in ML CI/CD and model deployment pipelines. Observability then carries it into production traffic.
Distributed Tracing and Correlation IDs
A trace only helps if it survives every hop. Each service, queue and provider call must pass the trace context along, or the request fragments into disconnected pieces.
The W3C Trace Context recommendation standardises this with the traceparent and tracestate headers, so that different tracing tools can participate in the same trace.
- Assign at the edge Create the trace and correlation ID where the request enters the system.
- Propagate everywhere Pass context through HTTP calls, queues, background jobs and tool calls.
- Attach to logs Write the correlation ID on every log line, so logs and traces join.
- Return to the client Expose the ID to support teams, so a complaint can be looked up directly.
Asynchronous steps are where propagation tends to break. Queues and scheduled jobs need the context written into the message, not left in a thread-local variable.
Alerts and Incident Diagnosis
Good alerts are built on service level indicators and objectives. An SLI is a measured value, such as the share of requests answered within 3 seconds. An SLO is the target for it.
- Alert on objectives Page on SLO burn, not on every error spike.
- Route by ownership Send each alert to the owner of the component, using the dependency map.
- Start from a trace Include example trace links in the alert, so diagnosis starts from evidence.
- Build the timeline Line up deployments, data versions and provider incidents against the symptom.
- Review and harden Add the missing signal or test that would have shortened the incident.
Model-quality alerts, such as drift or groundedness drops, arrive from monitoring. Observability is what turns them into a diagnosis. Keep both alert streams in one incident process, so the same event is not investigated twice.
Useful SLIs for AI features are simple ratios. One is the share of requests answered within a latency target. Another is the share completed without a provider error or fallback. For agents, track the share of runs that finish inside their step budget. Each should map to something a user would notice.
Business-Level Observability
Technical health does not guarantee business value. A fast, error-free assistant can still fail to resolve customer issues.
- Task completion or resolution rate per AI feature.
- Escalation rate to human agents.
- User corrections, overrides and negative feedback.
- Business outcomes linked to requests, such as orders placed or cases closed.
Joining these outcomes to traces shows which components and versions actually affect results. It also changes incident priority. A slowdown on the refund flow matters more than one on an internal FAQ tool.
Outcome signals often arrive late. A case marked resolved today may be reopened next week. Store the correlation ID with the outcome record, so late signals can still be joined back to the request that produced them.
Reference Architecture
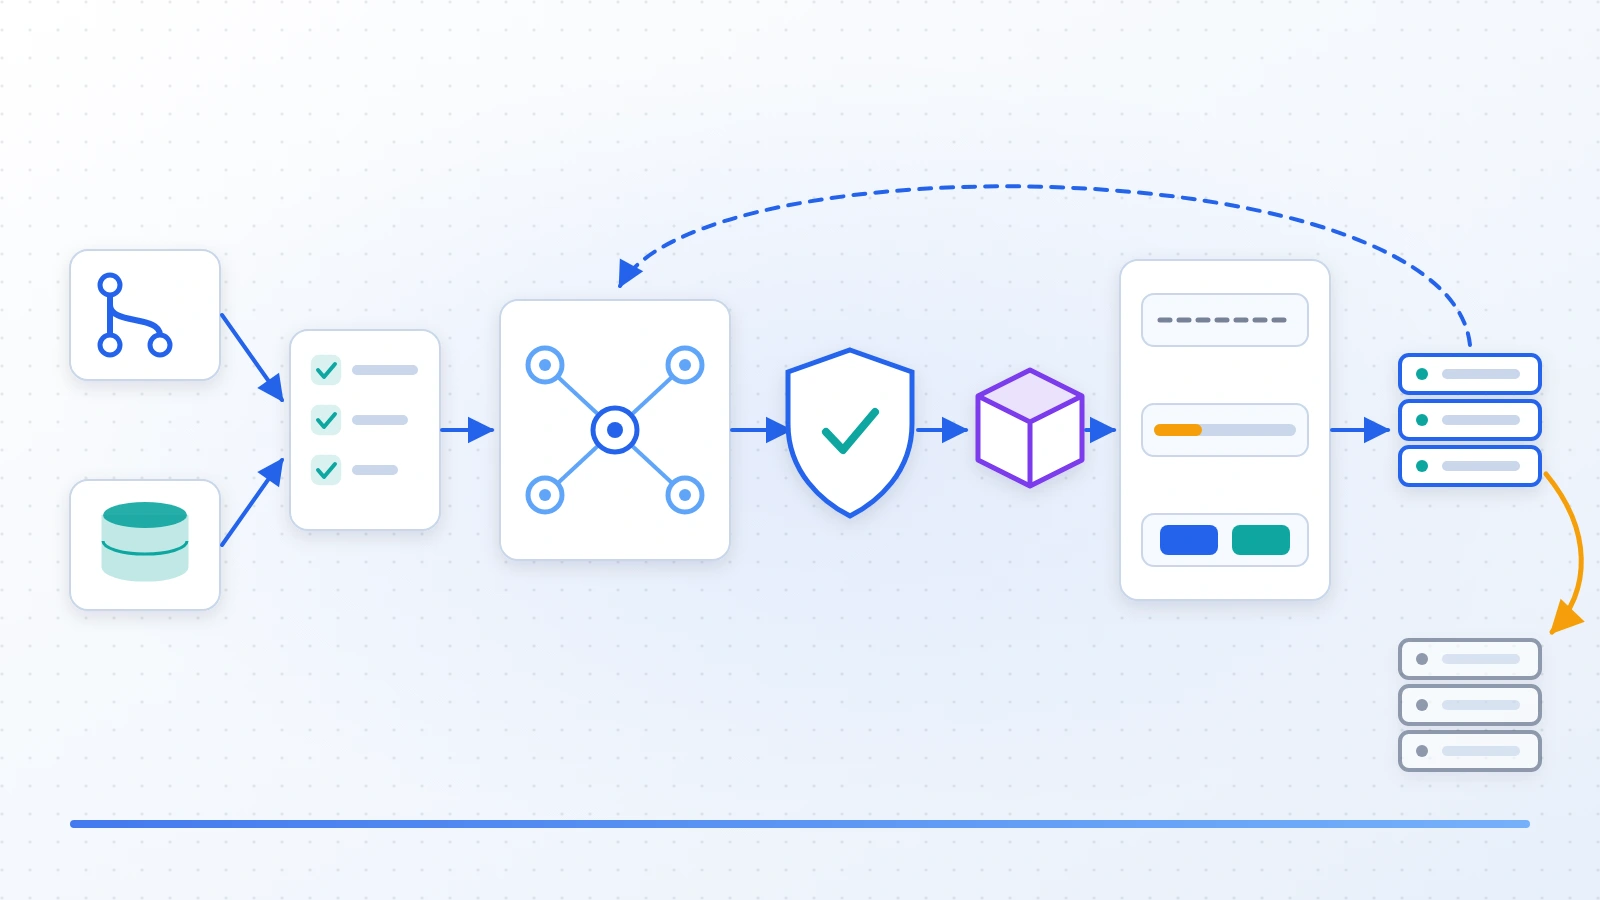
A practical AI observability stack has five layers. Each can be built from open-source or managed tools.
- Instrumentation SDKs and middleware in every service emit traces, metrics and logs with shared context and version attributes.
- Collection A collector receives, samples, redacts and routes telemetry, keeping sensitive content under policy.
- Storage Time-series storage for metrics, a trace store and a log store, joined by correlation ID.
- Analysis Dashboards per component and per business flow, trace search and version slicing.
- Response SLO alerting, ownership routing and an incident timeline shared with model monitoring.
Start with tracing and version attributes on the critical path. They answer the most questions per unit of effort, and every later layer builds on them.
Sampling keeps the volume manageable. Keep every trace that errors, breaches a latency target or triggers a guardrail, and sample the healthy majority. Head-based sampling alone discards the interesting requests before anyone knows they were interesting.
Set retention per signal. Metrics are cheap to keep for months. Full traces and content logs are expensive and sensitive, so keep them for a shorter, documented period.
Instrument once with shared context, and every later question becomes a query instead of a code change.
Frequently Asked Questions
What is AI observability?
AI observability is the ability to explain what a production AI system is doing and why. It uses traces, metrics, logs and version metadata across every component a request touches, including retrievers, model providers, tools and data pipelines.
How is AI observability different from model monitoring?
Model monitoring checks whether a model is still performing correctly, using signals such as drift, accuracy and groundedness. AI observability covers the whole system and explains why behaviour changed, by tracing requests across components and versions.
What should be traced in an LLM application?
Trace the request from entry to response: prompt assembly, retrieval, each model call, tool calls and guardrails. Record latency, token counts, model identifier, prompt version and index version on the relevant spans, with one correlation ID throughout.
How do you observe AI agents?
Record each planning step, tool selection and tool result as spans within the request trace. Track tool-call errors, step counts and budget limits, and keep an auditable record of every action the agent takes in a business system.
Which metrics matter most for AI cost and performance?
Latency percentiles per component, input and output tokens per request, cost per request and per feature, and provider rate-limit and retry counts. Add cache hit rates and, for self-hosted models, GPU utilisation and queue depth.
Should prompts and responses be logged?
They are valuable for debugging but can contain sensitive data. Log references or redacted content by default, and retain full content only where access, retention and privacy controls are in place.