

A vessel ETA prediction model is only useful if it beats the method planners already rely on. Test both on the same calls and forecast horizons, using only the data that was available when each forecast was made.
Then compare typical error, large misses, prediction availability and interval coverage. Together, these measures show whether a better average becomes information a planner can act on, or whether it hides failures at the moments that matter.
Which Arrival Event and Forecast Horizon Should ETA Predict?
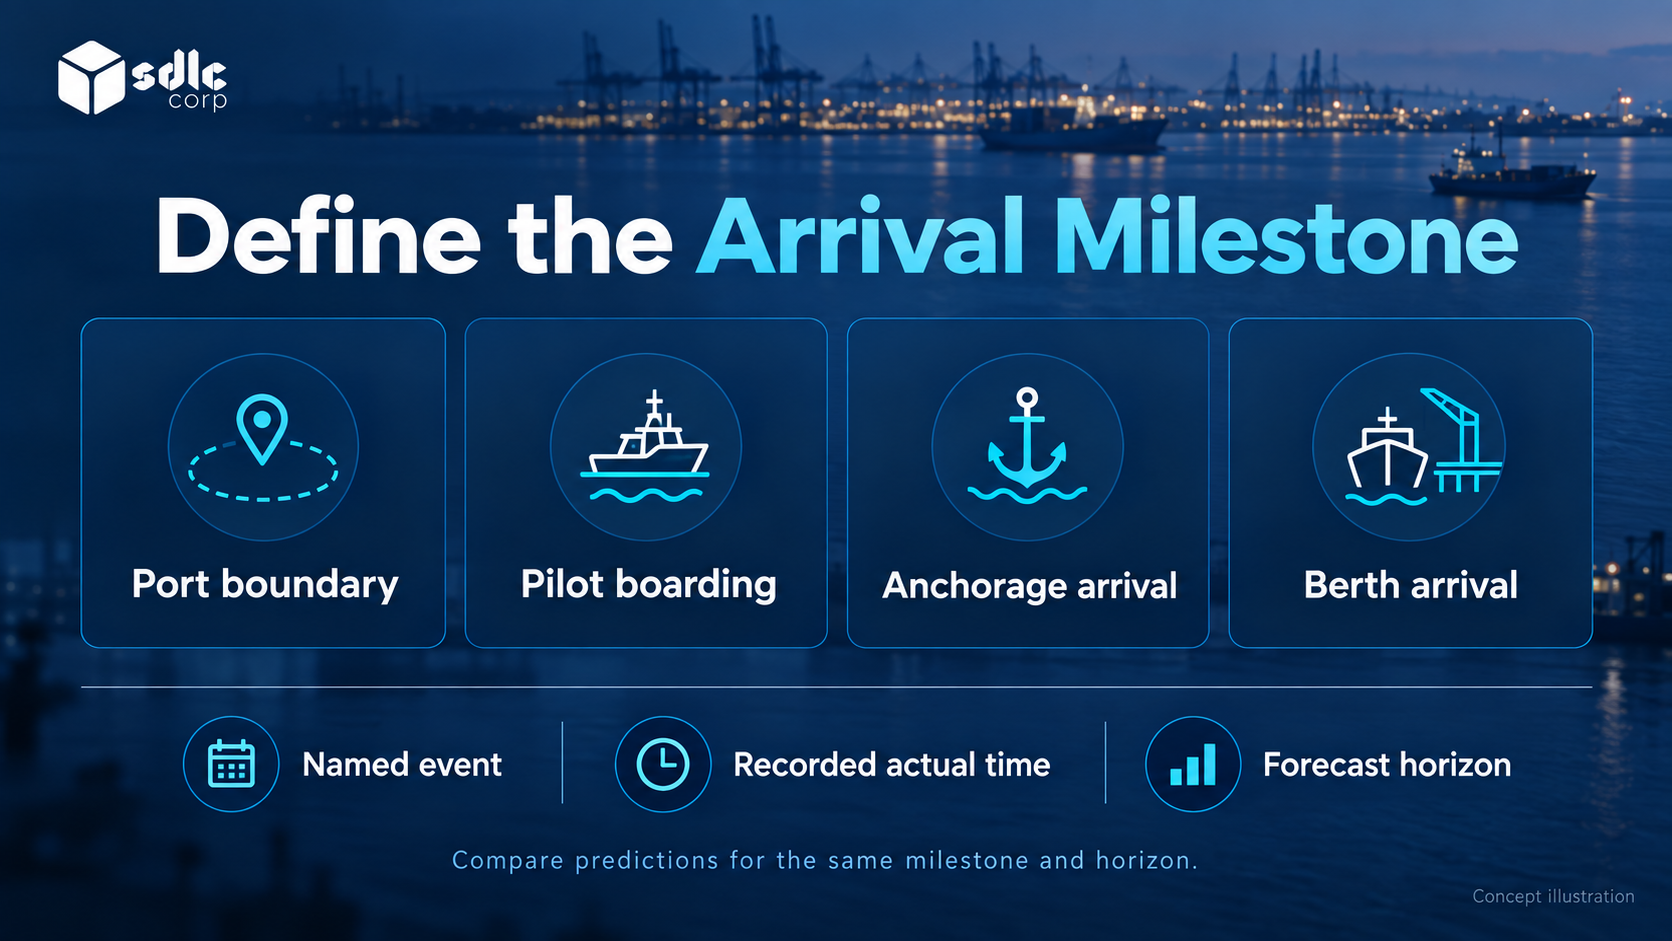
Estimated time of arrival (ETA) means little until you name the arrival. Specify the milestone, the source of the actual timestamp and the horizon at which each forecast is scored. A six-hour forecast and a one-hour update are separate tests.
| Definition | Question to Settle |
|---|---|
| Target event | Which arrival milestone is being predicted? |
| Actual label | Who records the event, and how is it corrected? |
| Prediction horizon | When will the user receive the estimate? |
| Operational action | Which planning decision can change as a result? |
Industry definitions help here. The IMO Just In Time Arrival Guide frames on-time arrival around the pilot boarding place, once berth, fairway and nautical services are available. Berth arrival is a different milestone with a different forecast.
Port call data standards draw the same line. The S-211 Port Call Message Format separates estimated, requested, confirmed and actual timestamps, so a forecast never has to overwrite a recorded event.
Do not train on a convenient database timestamp if it records a different event from the one the planner needs. Name the planning task, the reviewer and the fallback method before you choose any vessel ETA prediction model.
Keep arrival prediction separate from congestion forecasting, which is covered in Predictive Analytics for Port Anchorage Congestion. The target, denominator and planning response differ, even when some inputs are shared.
Build a Dataset That Excludes Future Information
Reconstruct What Was Knowable at Prediction Time
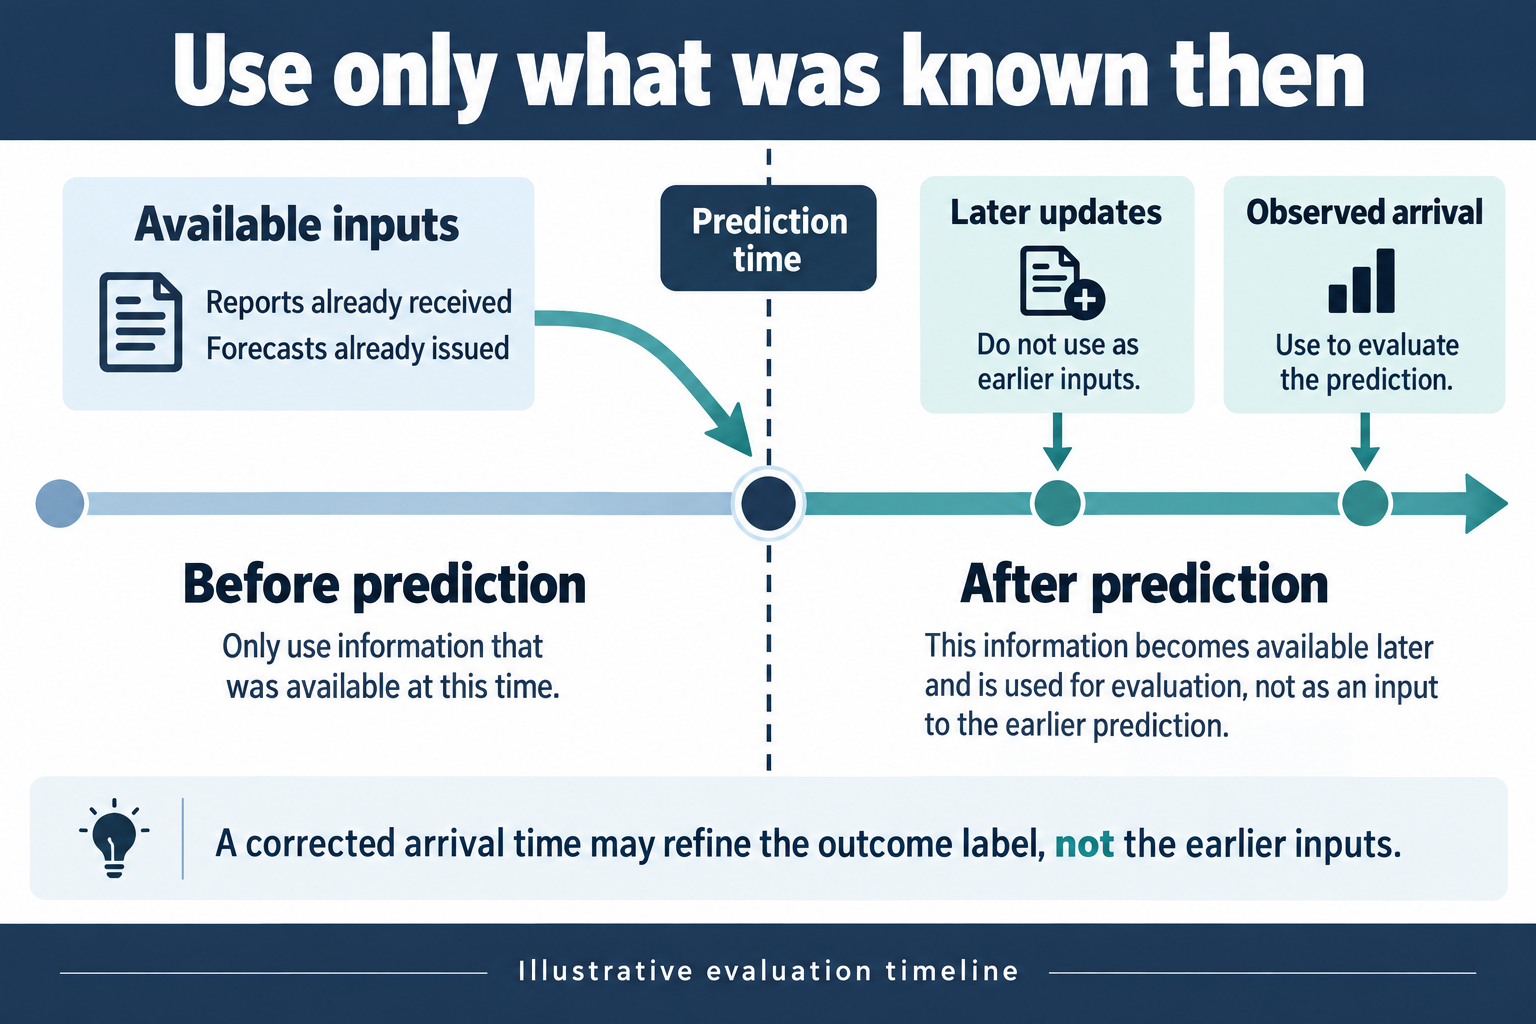
For every training example, rebuild the information available at prediction time. Later berth changes, corrected arrival records and completed service times must not leak into earlier predictions. Store when each value became available, not only when the event happened.
Candidate inputs include Automatic Identification System (AIS) position reports, remaining route distance, call details and environmental forecasts. Test each one rather than assuming it helps, and drop any input that does not improve the forecast.
For weather and tide, use the forecast that existed at prediction time, with its issue time and validity window. A historical observation the operator never had is not a fair substitute for the forecast they actually used.
Check AIS Data Quality First
AIS feeds contain gaps, duplicate positions and destination fields that crews do not always update. Flag every gap longer than your agreed threshold, and record whether the vessel's reported ETA was stale when each forecast was made.
These flags do two jobs. They can serve as model inputs, and they define the disrupted-feed segment that the evaluation must report separately rather than averaging it away.
Choose a Baseline and the Metrics to Report
A model has to beat something specific. Fix the baseline and every metric before the evaluation starts, so nobody picks the measure that happens to flatter the result afterwards.
Use the AIS-Reported ETA as a Starting Baseline
The simplest fair baseline is often the ETA each vessel broadcasts through AIS. It costs nothing, it is available whenever the feed is live, and it is usually the estimate planners already see.
Where the port already runs a schedule-based or agent-reported estimate, test against that as well. The model earns its place only if it improves on the estimate it would replace, on exactly the same calls.
Report Error, Bias and Interval Quality
Mean absolute error (MAE) is the average absolute gap between predicted and actual arrival. Report it with the median absolute error and the 90th percentile error, because the tail is where missed service windows come from.
Report signed error as well. A model that is consistently early and one that is consistently late can share the same MAE, yet they cause very different planning problems.
If the interface shows a prediction interval, check coverage and width together. An 80% interval should contain roughly 80% of actual arrivals. The Winkler score, explained in Forecasting: Principles and Practice, combines both.
Evaluate on Rolling Time Windows
Shuffled train and test splits let future patterns leak into training. Scikit-learn's guidance on time series cross-validation explains why ordinary shuffling gives misleading results for time-dependent data.
Use rolling-origin evaluation instead. Train on data up to a cutoff date, test on the period that follows, then move the cutoff forward and repeat. One unusual month then cannot decide the result on its own.
Test a Vessel ETA Prediction Model at Three Planning Horizons
Illustrative example
This calculation uses 100 held-out calls at each horizon, which is not a recommended sample size. Choose an evaluation set that covers the operating conditions the model will face.
Error comparisons use the 96 calls where both the baseline and the model produced a forecast. Availability is reported separately, and later corrections are excluded from prediction-time inputs.
| Horizon Before Arrival | Baseline MAE | Model MAE | 90th Percentile Error (Baseline / Model) |
|---|---|---|---|
| 6 hours | 50 minutes | 38 minutes | 110 / 105 minutes |
| 3 hours | 32 minutes | 25 minutes | 75 / 70 minutes |
| 1 hour | 20 minutes | 15 minutes | 45 / 55 minutes |
At six hours, MAE falls from 50 to 38 minutes, a 24% reduction: (50 − 38) ÷ 50. At one hour the reduction is 25%, but the 90th percentile error worsens from 45 to 55 minutes.
A planner booking a narrow pilot or berth window may reject that trade-off despite the better average. The right answer depends on which horizon drives the decision, not on the headline score.
Read the Results as a Planning Decision
| Additional Check | Sample Result | Decision |
|---|---|---|
| Forecast availability | 96 of 100 calls | Keep the baseline for the four calls without a model forecast |
| Disrupted-call mean absolute error | Model 70 minutes; baseline 60 minutes | Investigate that segment before operational use |
| 80% prediction interval coverage | 77 of 96 forecasts (80.2%) | Coverage meets target; now check width and subgroup coverage |
Why the Median and the Mean Both Matter
Take three forecasts with absolute errors of 10, 20 and 60 minutes. The median is 20 minutes, which looks acceptable, but the MAE is 30 minutes because one large miss pulls the mean upwards.
Neither number alone describes what a planner experiences. Keep the full error distribution and the decision horizon beside every headline score, and flag any horizon where the tail gets worse.
Break Results Down by Segment
An overall score can hide the conditions in which the model fails. Report results separately for the segments your planners care about, and compare the baseline on exactly the same calls in each one.
- Vessel type and size, since container, bulk and tanker calls follow different approach and waiting patterns.
- Terminal or berth group, where local procedures change approach time and the point at which arrival is recorded.
- Season and weather band, including periods of strong wind, restricted visibility or narrow tidal windows.
- Feed quality, separating calls with AIS gaps from calls with continuous tracking throughout the approach.
- Plan changes, such as berth reallocations or revised pilot bookings made after the forecast was issued.
Watch availability as closely as error. If the model forecasts only the easy calls, lower error on that subset does not prove a better service for the whole planning workload.
Integrate the Forecast as an Estimate
Store the model version, prediction time, target event and input freshness with every forecast. Keep the forecast separate from requested, confirmed and actual milestones, in line with the S-211 time types described earlier.
A new prediction can prompt a review, but it should never silently rewrite a confirmed operating commitment. Give coordinators a clear route from each vessel's ETA prediction back to the underlying call and model version.
Show when each prediction was last computed and when it fell back to another method. What Port Operators Need From A Dashboard explains why screens need a no-prediction state rather than assuming an estimate always exists.
Monitor the Deployed Model
Evaluation does not stop at launch. Define in advance what each monitoring signal triggers, so a drop in forecast quality leads to a decision rather than a chart nobody reads.
| Monitoring Question | Response to Define |
|---|---|
| Are required inputs arriving? | Qualify or suspend affected predictions |
| Has error changed by horizon? | Investigate data and operating changes |
| Are operators ignoring outputs? | Review usability and decision relevance |
| Has a model version changed? | Compare results before wider use |
Assign an owner to each response. A dashboard of errors is not an operating process unless someone reviews it regularly and has the authority to restrict use.
Keep earlier model versions and their evaluation evidence so any change can be investigated or rolled back. Where AI Can Help Anchorage Operations And Where It Cannot sets out the wider control model for these decisions.
Structure a Credible Pilot
Use a bounded group of calls and one defined planning decision. Run predictions in shadow mode first, then compare them with actual events and the baseline, including calls where inputs were missing.
Agree up front whether the pilot tests prediction quality, user adoption or a downstream workflow benefit. They are related outcomes, but each needs its own acceptance criteria, set before any results are scored.
A credible pilot report names the arrival event, forecast horizons, baseline and difficult segments. It then explains how the model's ETA prediction and its uncertainty change what the operator does next for each vessel.
Conclusion
Testing a vessel ETA prediction model comes down to a fair comparison. Use one shared evaluation set, score each decision horizon separately, and hold the model to the estimate planners already have.
Inspect disrupted calls, missing forecasts and interval coverage alongside the headline error. Use the model only within the conditions it was tested in, and decide in advance when to withhold a forecast and what planners see instead.
Discuss an ETA Pilot with SDLC Corp
The SDLC Corp AI Development Services team can evaluate an ETA capability alongside our Anchorage Management Software. Share your arrival-event definitions, historical data rights and planning horizons.
We will compare your vessel ETA prediction model with the existing baseline on held-out records, including interval coverage, unavailable forecasts and difficult calls. A supervised pilot follows, with acceptance conditions agreed before results are scored.
Frequently Asked Questions
What Makes an ETA Comparison Fair?
Use the same eligible calls, arrival event and prediction horizons for every method. Both must see only information available at prediction time, and missing forecasts must be reported rather than quietly excluded.
Is the AIS-Reported ETA a Good Baseline?
Usually, yes. It is free, widely available and already familiar to planners, so beating it shows real added value. Where a port uses a stronger agent or schedule-based estimate, compare against that as well.
Which Metrics Should an ETA Evaluation Report?
Report MAE, median and 90th percentile absolute error, and signed error for bias, all by horizon. Add forecast availability and, where intervals are shown, coverage together with width or an interval score.
Can Corrected Arrival Times Be Used in Training?
Yes, as outcome labels. They must not leak into the input features of earlier forecasts. Keep the final actual time separate from what the system knew when it made each prediction.
Is a Narrow Prediction Interval Better?
Only if it also reaches its stated coverage. A narrow interval that often misses the actual arrival gives planners false confidence in the precision of the forecast.
When Should a Forecast Be Withheld?
Withhold or qualify it when required inputs, such as AIS updates, are missing or when conditions fall outside those tested. Show the reason and the fallback estimate instead of an unsupported confidence value.