

A port operations dashboard should help an operator identify work and take the next permitted action. Counts such as unresolved requests, unassigned exceptions and stale sources are useful when each opens the corresponding records and uses a clear definition.
Without those definitions, a falling total can be misleading. Assignment, duplicate removal and closure change different aspects of the workload, even if they all make part of the screen look better.
Dashboard Workflows For Operators, Supervisors And Managers
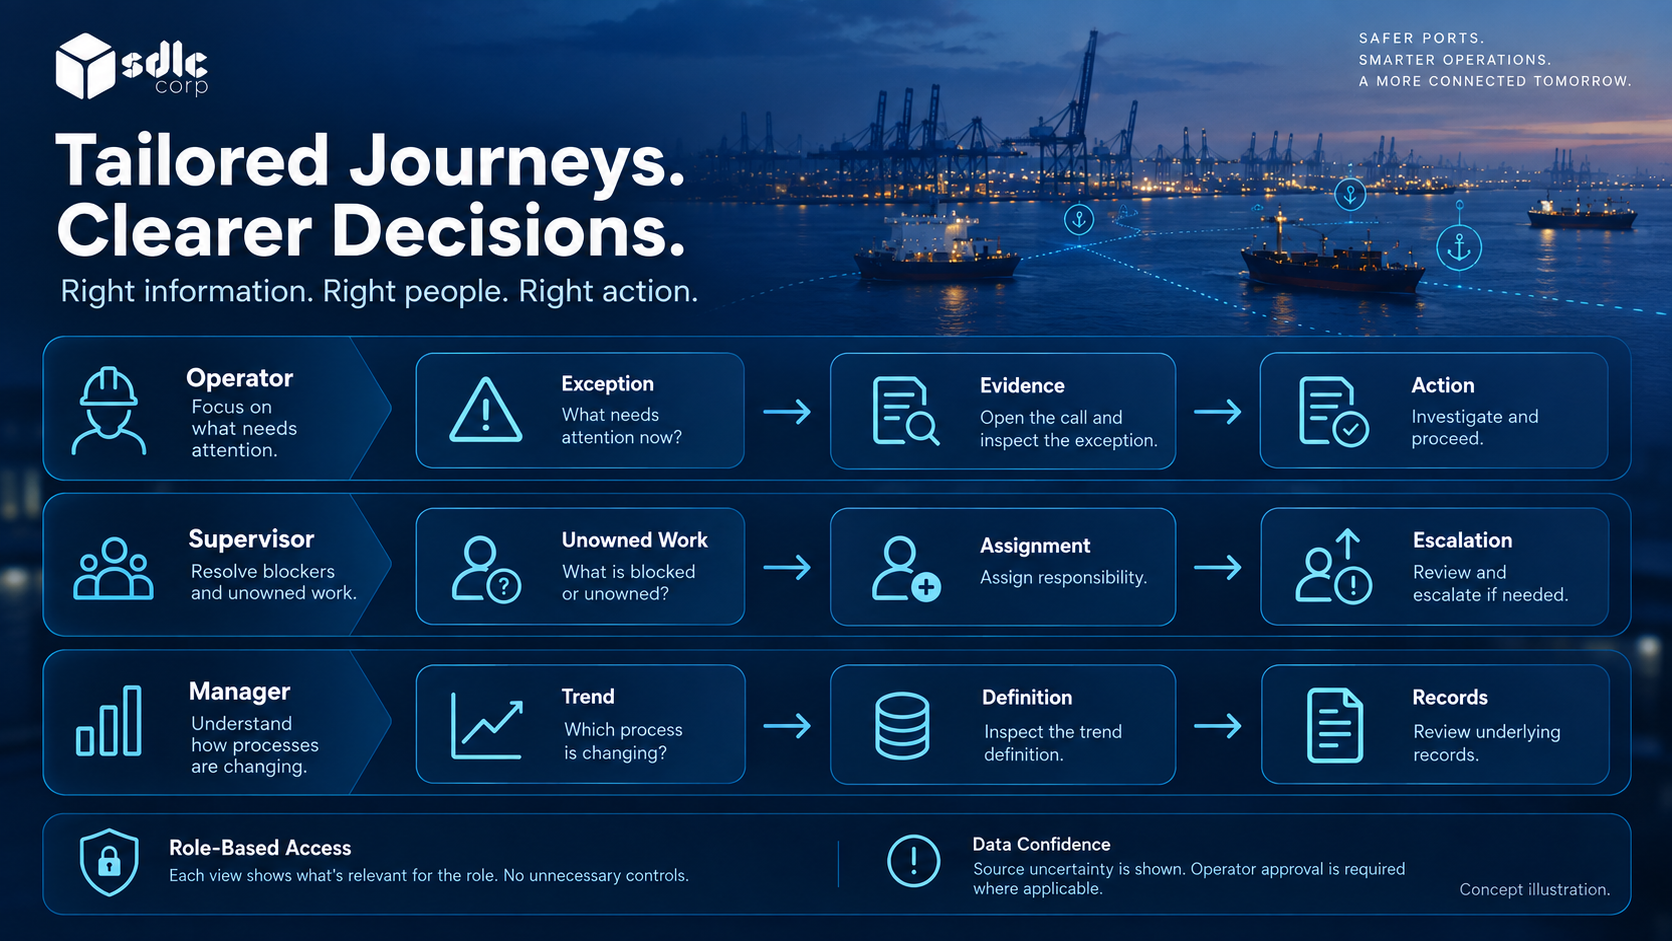
Connect Each Dashboard Role To Its Next Permitted Action
| User | First question | Useful next step |
|---|---|---|
| Operator | What needs attention now? | Open the call and inspect the exception |
| Supervisor | What is blocked or unowned? | Assign responsibility and review escalation |
| Manager | Which process is changing? | Inspect the trend definition and underlying records |
Do not make an operator interpret an executive chart before opening a pending request. Conversely, a management view should not expose editing controls simply because they exist elsewhere in the application. Role-based access design should follow these journeys.
Example: A Supervisor Investigates A Rising Count
Imagine that the dashboard shows more unresolved requests than the previous shift. A useful count opens the affected worklist with the same filters and state definitions. The supervisor can distinguish missing submissions from internal approvals, identify the owner and act on the exception. A chart that cannot explain its contributing records leaves the investigation in a spreadsheet.
A dashboard total should reconcile with the underlying request and allocation records. Agree those states within the anchorage application workflow before designing summaries.
The vessel-tracking operator journey helps keep the displayed target, its identity evidence and the related work item connected.
Port Dashboard Performance Indicators: Definitions, Denominators And Drill Downs
For each metric, document the business question, event definition, time interval, source, exclusions, and owner. Explain whether a count represents vessels, calls, requests, allocations, or observations. One vessel can contribute several records, so those measures are not interchangeable.
Use a drill down from a total to the records that produced it. Preserve the selected period and filters. If a report excludes incomplete data, say so beside the result. A zero should mean zero, not a failed query or unavailable feed. A shared source of truth model helps keep the dashboard aligned with operational records.
Starter Performance Indicator Definitions For An Anchorage Dashboard
A key performance indicator (KPI) needs an agreed definition and a way to inspect the records behind its total.
| KPI | Definition to agree | Drill down needed |
|---|---|---|
| Open requests | Count of requests in the defined unresolved states at a stated time | Requests, blockers and owners |
| Time awaiting internal approval | Time spent in the approval state, excluding separately classified holds | State transitions and hold reasons |
| Occupancy utilization | Occupied eligible capacity divided by usable capacity for the same area and time | Allocations, restrictions and capacity definition |
| Stale displayed tracks | Tracks beyond the source-specific freshness rule, with unknown time cases identified separately | Last evidence, source and monitoring state |
Do not mix berth slots, vessel counts and area measures in one utilization ratio. A changed restriction can reduce usable capacity without another vessel arriving. Show that denominator change beside the trend so managers do not mistake it for increased demand.
How Operational Data Reaches The Dashboard
An application programming interface (API) or event consumer builds a read view from authoritative records; the dashboard queries or subscribes to that view under the user's permissions.
Define when it refreshes and how it reconciles missed changes. Keep actions such as approval on the owning workflow service, which rechecks current state. A stale dashboard count should never become the authority for an otherwise invalid action.
Assign A Source, Rule Owner And Action
| Metric | Source And Refresh Rule | Threshold Owner | Action And Drill-Down |
|---|---|---|---|
| Open requests | Authoritative request states; refresh after accepted changes and reconcile missed updates | Operations owner | Inspect the same unresolved records counted in the total |
| Approval waiting time | State history with approved hold exclusions; show calculation time | Approval-process owner | Open the oldest case and its hold history |
| Usable-capacity utilization | Approved capacity model and restrictions for the same time | Capacity-policy owner | Inspect allocations and denominator changes; omit the ratio if units are not comparable |
| Stale tracks | Observation times and source-specific freshness rule; evaluate age at display | Source and operations owners | Inspect source health, age and affected workflow |
A refresh interval and a stale-data threshold answer different questions. Configure each from its purpose and show unknown timestamp cases separately rather than forcing them into a current/stale count.
Follow A Shift Worklist Through Assignment And Closure
Illustrative example
The shift starts with the worklist below. The oldest age measure uses creation time, while “unassigned” means no current responsible user.
| Measure | Calculation / Sample Value | Operator Action |
|---|---|---|
| Unresolved requests | 18 requests not closed or cancelled | Open those same 18 records |
| Unassigned share | 3 unassigned ÷ 18 unresolved = 16.7% | Supervisor assigns the three owners |
| Oldest unresolved age | 10:00 minus 08:35 = 85 minutes | Inspect R-09 and its blocking reason |
| Source freshness | Last valid observation 09:57:30; age 150 seconds | Review source loss alert under local threshold |
| Reconciliation backlog | 7 conflicts; 2 beyond the locally configured review target T | Review the two flagged cases under the approved priority policy |
From A Rising Count To A Resolved Task
At 10:00, the supervisor opens the three unassigned requests. R-12 lacks a document, R-13 needs an internal decision, and R-14 was created twice. Assigning them to one generic “waiting” category would hide three different actions.
| Record | Owner And Action | Expected Metric Change |
|---|---|---|
| R-12 | Agent supplies missing document | Unassigned falls; unresolved stays until processed |
| R-13 | Duty approver reviews the decision | Unresolved falls only when the defined workflow closes |
| R-14 | Operator resolves the duplicate with retained history | Duplicate no longer inflates the active count |
The count and worklist must use the same filters and update point. A dashboard that reports 18 but opens 21 records needs reconciliation before anyone uses the metric to judge shift performance.
Recalculate The Counters After Each Action
Starting from the 18 unresolved requests and three unassigned requests, count assignments separately from closures. All numbers use the same worklist filter.
| Action | Unresolved | Unassigned | Unassigned Share |
|---|---|---|---|
| Starting view at 10:00 | 18 | 3 | 3 ÷ 18 = 16.7% |
| Assign R-12 to its agent | 18 | 2 | 11.1% |
| Assign R-13 to the approver | 18 | 1 | 5.6% |
| Resolve duplicate R-14 and retain its history | 17 | 0 | 0% |
| Close R-13 after its required workflow finishes | 16 | 0 | 0% |
Assigning R-12 does not mean its missing document has arrived. Closing the duplicate reduces the unresolved denominator; changing ownership alone does not. The screen should allow the supervisor to open the exact records counted after each transition.
When an exception needs an allocation change, open the authorized allocation workflow rather than changing state from a dashboard count.
Show Stale, Missing And Conflicting Data In Each Panel
Show source age near the information it qualifies. A page level last refreshed label is insufficient when different feeds update at different times. Separate current, stale, unavailable, and conflicting states using text as well as color. A user should not need to open a help page to discover that a green marker represents old data.
Design an explicit unavailable state for each panel. Keep the last known value only when its age and meaning remain visible. Avoid animated loading placeholders that continue indefinitely while the operator assumes work is progressing. Include a route to the relevant exception or support owner.
Make The Interface Work On Small Screens
The World Wide Web Consortium guidance on use of color explains why color alone cannot convey essential information. Pair a stale or blocked status with a text label or another visible cue. Include contrast, keyboard access and assistive technology checks in the wider accessibility assessment.
Use responsive sections that follow the available space. Tables may need a labeled horizontal scroll region, while summaries and action lists should stack naturally. Do not clip content into fixed height cards. Support longer vessel names, translated labels, and enlarged text without hiding the next action.
Keyboard users should be able to reach filters, open a call, inspect an alert, and return to the same place. Give controls visible focus states and descriptive labels. Preserve focus during live updates. An accessible list should accompany the map rather than requiring every user to select a tiny geographic marker.
Test The Dashboard With Operator Tasks
Ask a participant to find the oldest unresolved request, identify its owner, inspect the blocking reason, and determine what can be done next. Then repeat with a stale feed and a conflicting call record. Observe whether the interface reveals the uncertainty or encourages an unjustified decision.
| Task | What to observe |
|---|---|
| Find unowned work | Clear filtering and assignment route |
| Inspect a stale source | Visible age, scope and consequence |
| Follow a metric | Consistent drill down to source records |
| Resume after refresh | Selection and keyboard focus preserved |
The queue state model provides a useful test dataset. Include empty lists, long labels, large result sets, and restricted users rather than testing only a populated administrator screen.
Group map layers by task: approved zones, restrictions, source-aware tracks and selected call context. Check legibility at the actual control room viewing distance as well as on phones. Log assignments and overrides from the dashboard, and distinguish transport health from the freshness of each displayed result.
Separate Operational And Analytical Releases
First deliver the worklists and exceptions needed for daily operation. Add analytical views once the events and definitions are stable. A chart built on inconsistent states will become a source of disagreement rather than a decision aid. Usability and acceptance criteria should describe the tasks and evidence required for each release.
Review each dashboard with a task rather than a screenshot: find the exception, explain the number and reach the record needed to act.
Use stable metric definitions in the business-case measurement plan so changes in counting rules are not mistaken for operational benefits.
Conclusion
Trace each dashboard measure back to its worklist and test how assignment, duplicate handling and closure affect the result. The displayed total should reconcile to the records visible under the same filters.
Accept the operational dashboard when users can identify responsibility and act within their permissions. Treat longer term analytics as a separate requirement with its own definitions and reporting periods.
Explore Dashboard Design With SDLC Corp
Bring the operator task list and metric definitions to a discussion with SDLC Corp about the digital anchorage management platform and any necessary custom software development services. Request a proposed dashboard that connects each count to its underlying records, source age and permitted action. Assess it with representative users, including degraded data and small-screen tasks, before agreeing the design scope.
Frequently Asked Questions
Which Measures Belong On An Operational Dashboard?
Start with measures tied to current work: unresolved requests, missing owners, stale sources and reconciliation backlog. For each, specify the population, age or status rule, and the action its responsible user can take.
Why Might Two Counts Disagree?
They may use different filters, time boundaries, permissions or state definitions. Compare the underlying record sets before treating the difference as a data loss problem or assuming either total is correct.
Does Viewing A Worklist Allow A User To Change It?
No. Permission to view records is separate from permission to assign, approve or close them. Enforce the action and record checks on the server, even when the dashboard hides unavailable controls.