

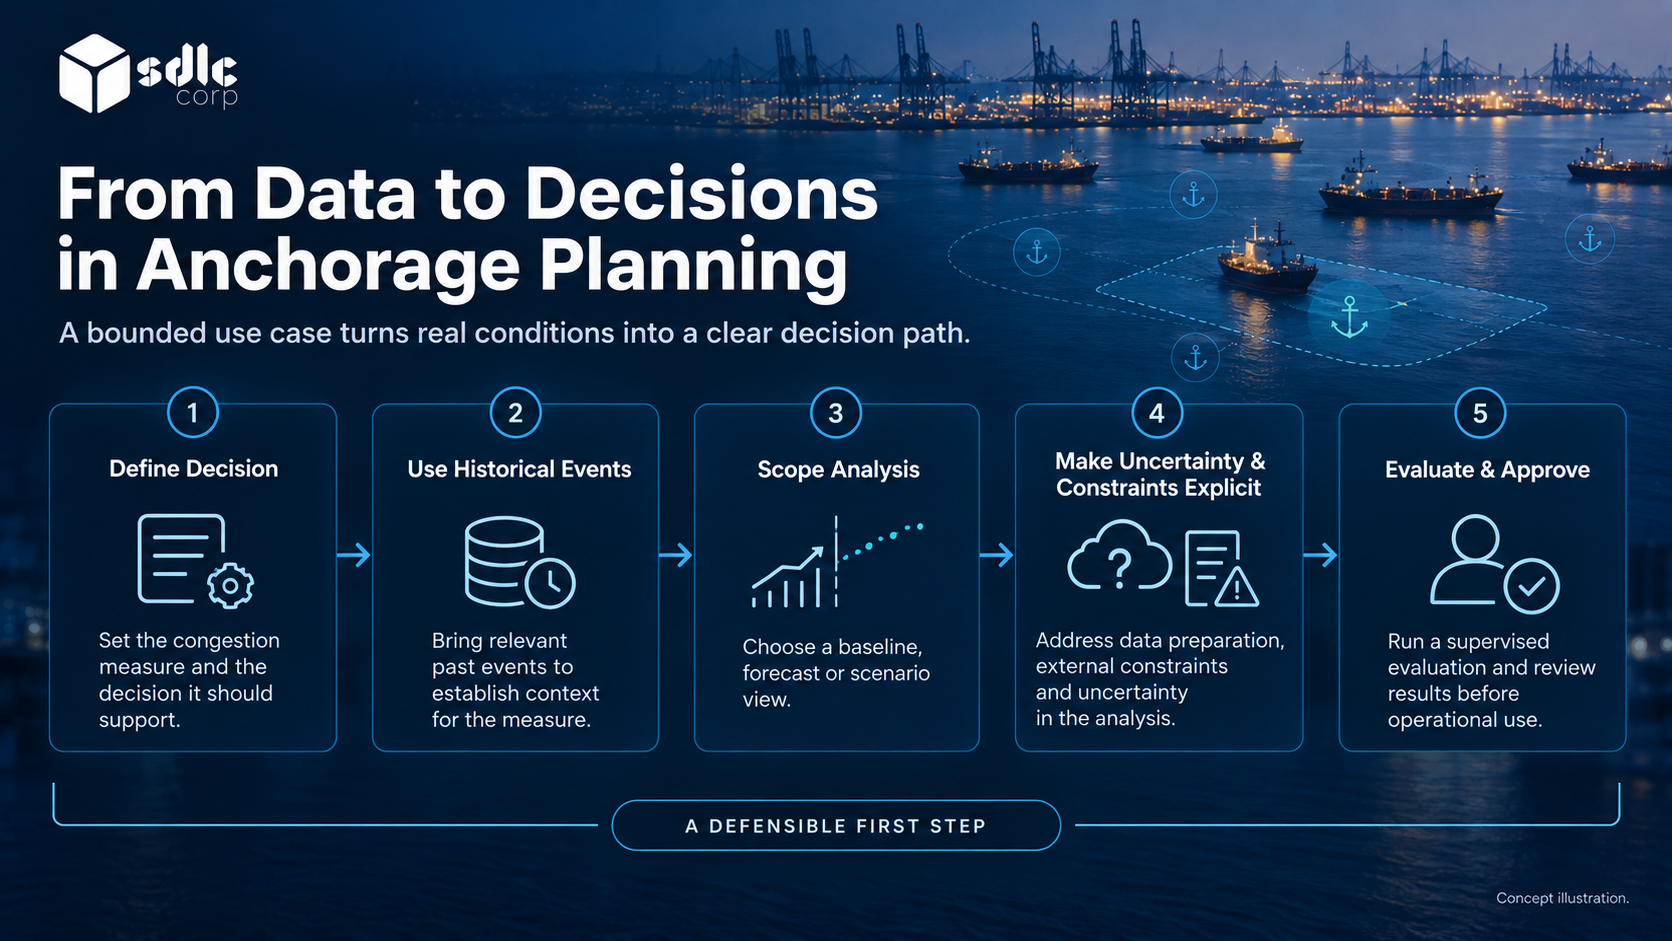
Port congestion forecasting compares expected demand with usable capacity over a chosen period. Before building a forecast, define what congestion means for your port: a count, an occupancy level, an expected delay or another condition tied to an operational response.
A warning needs enough lead time for that response and must expose uncertainty or stale inputs. Predicting demand does not change the capacity or restrictions that the port has approved.
The problem is growing. UNCTAD's Review of Maritime Transport 2025 reports that average container ship waiting time reached 6.4 hours in developed countries and 10.9 hours in developing countries by December 2024, up from 5.2 and 10.2 hours a year earlier.
Choose What to Forecast: Occupancy, Requests or Readiness
Identify who will act on the forecast. A shift supervisor may need an approaching workload peak, while a planner may need a scenario for berth readiness changes. These decisions need different horizons and different data.
Do not combine them into one unexplained red-amber-green indicator. Each measure below answers a different planning question and carries its own qualification.
| Planning Question | Candidate Measure | Important Qualification |
|---|---|---|
| Is workload building? | Requests entering an unresolved state | Administrative work is not vessel waiting |
| Is capacity constrained? | Observed occupancy and approved reservations, reported separately against usable capacity | Define overlap and restrictions before calculating utilization |
| Is coordination slipping? | Unconfirmed readiness milestones | Identify the responsible dependency |
| What if a plan changes? | Scenario outcome | A scenario is not a factual forecast |
Separate the delays a system can influence, such as unconfirmed readiness milestones, from external constraints like weather windows or berth outages. Only the first group can be improved through better coordination.
Name the person who reviews the forecast and the planning action it can inform. An alert without an owner becomes noise, however accurate the underlying prediction is.
When a Percentage Misleads
A percentage is unsuitable when vessel and zone constraints cannot be expressed as comparable units. A 300-metre tanker and a small bulk carrier do not need the same space, depth or swing circle.
In that setting, forecast which requests will lack a feasible placement under the approved geometry and restrictions. Never turn a count of vessel icons into an occupancy denominator.
Keep prediction inside the limits set out in Where AI Can Help Anchorage Operations And Where It Cannot. An alert informs review; it cannot authorize an allocation or a movement.
Reconstruct Arrival, Capacity and Restriction History
Collect the event history needed to reproduce each measure. Preserve changes in capacity, operating restrictions, arrival estimates and call status with their effective times. A current snapshot cannot explain what was known during an earlier planning decision.
Know Which Data Sources Feed Each Measure
- Automatic Identification System (AIS) position reports, which show vessels approaching, anchored or moving between zones.
- Port call records, including requested, confirmed and actual milestones for each call.
- Berth schedules and release estimates, which determine when capacity actually frees up.
- Pilot, tug and mooring bookings, since a berth can be free while the services to reach it are not.
- Restriction notices covering weather, tide windows, channel closures and dredging works.
Check whether missing data clusters around busy or disrupted periods. Excluding those intervals makes a model look strongest exactly where it has not been tested.
Arrival estimates are a common input, and How to Test a Vessel ETA Prediction Model covers how to evaluate them. Their uncertainty should not disappear once they feed a congestion model.
Choose a Port Congestion Forecasting Method That Fits the Measure
Port congestion forecasting does not need one universal model. The right method depends on the measure you chose and the decision it supports. Start with the simplest method that can answer the planning question.
| Method | Best Suited To | Watch For |
|---|---|---|
| Rule-based projection (scheduled arrivals minus confirmed releases) | Fixed-slot areas with reliable schedules, and as a baseline for every other method | Ignores arrival uncertainty unless ranges are added |
| Queueing model | Estimating waiting time when arrivals and service times are fairly stable | Assumes comparable servers, so it is weak for mixed vessel sizes and geometry |
| Discrete-event simulation | Spatial anchorages, interacting restrictions and what-if scenarios | Needs careful calibration and validated service time distributions |
| Statistical or machine learning forecast | Request workload and arrival volumes with enough clean history | Can learn past interventions as if they were natural patterns |
Whatever the method, compare it with the rule-based projection first. Forecasting: Principles and Practice explains why simple benchmark methods belong in every evaluation, and why they are often surprisingly hard to beat.
Test a Fixed-Slot Forecast Only Where That Model Applies
Illustrative example
A port models Zone A as ten approved, comparable slots. Seven are occupied at 10:00, and three eligible arrivals and one release are expected by 12:00. This model holds only while slots, eligibility and restrictions remain comparable.
| Scenario | Slot Calculation | Planning Result |
|---|---|---|
| Arrivals and release occur | 7 + 3 − 1 | 9 of 10 slots requested, or 90% |
| Release is delayed | 7 + 3 | All 10 slots requested |
| Extra arrival, no release | 7 + 4 | Demand for 11 slots; one request lacks a feasible slot |
Connect a Planning Trigger to a Response
In this exercise, the configured advisory trigger is demand for nine slots within two hours. The coordinator checks the incoming calls and the release confirmation.
At 10:30 an arrival estimate becomes stale, so the display marks the forecast as degraded and keeps its calculation time visible. Planners see the warning without mistaking it for a fresh prediction.
The useful question is whether an allowed response can be agreed before the predicted constraint. One option is a changed arrival plan, the idea behind the IMO Just In Time Arrival Guide.
Under that concept, a vessel adjusts speed to reach the pilot boarding place when berth, fairway and nautical services are available. The forecast itself authorizes neither this nor any alternative; the responsible parties must agree it.
For areas whose capacity depends on vessel dimensions, swing space or interacting restrictions, replace slot arithmetic with a feasible allocation assessment. Dividing vessel count by a nominal total can show spare capacity when no valid allocation exists.
Separate Forecasts from What-If Scenarios
Show Which Assumptions the Scenario Changes
A forecast estimates an outcome from current information under a stated method. A scenario changes assumptions to examine a possible consequence. Label them differently in the interface so nobody confuses the two.
Show which berth, capacity, arrival or service assumption the user has changed, and provide a one-step way back to the baseline. Record assumptions beside the result so they stay visible when a chart is shared.
Avoid reporting an exact benefit from an untested intervention as though it were observed. Real outcomes depend on whether the assumptions hold and whether the proposed action is feasible.
Worked Capacity Scenario: Why the Denominator Matters
Suppose a weather restriction closes two of Zone A's ten slots. The same nine requests from the example above now meet eight usable slots, so one request lacks a feasible placement.
Measured against the nominal ten slots, demand still reads as 90% and looks manageable. Measured against the eight usable slots, it is 112.5%, an infeasible plan. The denominator decides whether the warning fires.
For a spatial scheme, reassess geometry and interacting vessel constraints rather than adjusting slots. Show a range of plausible outcomes, and keep scenario changes visible so a stress test is never mistaken for the expected result.
Connect Alerts to an Operating Playbook
Every alert needs an owner, a reason and a next step. Define how users acknowledge it, investigate the supporting calls, and close or escalate it.
Control repeated alerts so a persistent condition does not flood the queue with identical tasks. One open alert per condition, updated in place, is usually far easier to manage.
| Alert Design | Question to Answer |
|---|---|
| Trigger | Which measure and horizon caused it? |
| Evidence | Which inputs and assumptions contributed? |
| Ownership | Who reviews the condition? |
| Closure | What resolves or supersedes the alert? |
The display should make each alert actionable without requiring users to understand model internals. What Port Operators Need From A Dashboard explains why a stale forecast must look different from a low-risk result.
A projected capacity problem should then enter the allocation review described in Anchorage Allocation Software, where current restrictions and approval authority are checked again.
Test Warning Lead Time, False Alarms and Planning Value
Test on later observations rather than mixing past and future at random, as scikit-learn's time series evaluation guidance explains. Sound validation still cannot repair an ambiguous definition of congestion, so fix the target first.
Measure the Alerts, Not Only the Forecast Error
Compare every method with the rule-based projection over the same periods. Then score the alerts themselves, because a forecast with low error can still warn too late or too often.
| Alert Metric | What It Shows |
|---|---|
| Hit rate | Share of real congestion events that a warning preceded |
| False alarm rate | Share of warnings not followed by the predicted condition |
| Median lead time | How early warnings typically arrive, compared with the planning window |
| Forecast availability | Share of periods, especially disrupted ones, where a forecast existed at all |
A statistically improved forecast may still be unhelpful if it arrives after the planning window closes. Review false alarms and missed conditions with operators, since they know which warnings actually changed a decision.
Run in Shadow Mode First
Begin in shadow mode and document interventions separately from predictions. Otherwise an action taken in response to a warning changes the outcome, and the model appears wrong precisely because it was useful.
Judge value on three separate results: model performance, workflow adoption and business effects that can genuinely be attributed to the forecast. Each one needs its own evidence.
Keep unavailable forecasts in the evaluation record. If the model only produces estimates for easy periods, its reported accuracy hides limited usefulness during disruption, when warnings matter most.
The acceptance decision should state when the output may inform planning, and when the normal workflow must be used instead.
Conclusion
Good port congestion forecasting starts with a definition, not a model. Agree the congestion measure, threshold and responsible response first, then test whether warnings arrive early enough to support that response.
Record false alarms as well as missed conditions, and keep the forecast only where it improves the planning decision under realistic input quality. A warning with no feasible response should be reconsidered, however accurate it appears.
Scope a Forecasting Assessment with SDLC Corp
SDLC Corp can assess whether a congestion forecasting use case belongs within your Anchorage Management Software, and how our AI Development Services team would evaluate it. Bring the planning decision and your approved capacity model.
We will set out how demand, restrictions, uncertainty and false alarms will be measured. You will see whether the chosen measure supports a useful operator response before it becomes a product requirement.
Frequently Asked Questions
What Should Port Congestion Forecasting Predict?
Predict a condition the port can define and act on, such as requests lacking a feasible placement, or occupancy against usable capacity over a stated horizon. Keep the population and capacity assumptions explicit.
Should Congestion Be Shown as a Percentage?
Only where capacity can be expressed as comparable units, such as fixed slots. Where vessel size, swing space or restrictions vary, report which requests lack a feasible placement instead.
What Data Does a Congestion Forecast Need?
Typically AIS positions, port call milestones, berth schedules and release estimates, service bookings and restriction notices. Store each value with the time it became known, not only the time of the event.
How Much Warning Time Is Needed?
Work backward from the action the responsible team can take. Evaluate the forecast at that lead time, because a correct warning received after the chance to respond has little operational value.
How Is a Forecast Different from a Scenario?
A forecast estimates the likely outcome from current information. A scenario changes assumptions, such as a berth closure, to explore a possible consequence. Label them differently so a stress test is never read as the expected result.
What If Inputs Become Stale?
Show the missing freshness and follow the agreed fallback, which may qualify or suppress the forecast. Keep the last supported result distinguishable from a new prediction based on current observations.