
Connecting programme costs to monitoring and evaluation data can reveal whether an NGO is delivering the planned activities and what resources those activities consume. It does not automatically reveal impact. A spending total, an attendance count and an outcome measure answer different questions and need different evidence.
Keep spending, attendance and outcome observations distinct in the data model. Define the activity, indicator, reporting period and population before calculating a ratio. Then connect costs at a level where the allocation is meaningful and where reviewers can see the assumptions behind the result.
Activities, outputs and outcomes are different measures
An activity is work performed, such as delivering a training session. An output is an immediate product or service, such as completed sessions or participants trained under a defined completion rule. An outcome concerns a change, such as a measured improvement in a relevant capability.
These relationships should be explicit in donor reporting. Paying for training materials is evidence of expenditure, not proof that training occurred. Attendance supports participation, but it may not establish completion or later change. Avoid making the financial record carry conclusions it cannot support.
For each reported statement, identify the source record and review method. If a result depends on a survey, record its timing, population and limitations. If programme staff make an assessment, define the criteria so the meaning does not vary silently between locations.
The indicator definition determines the denominator
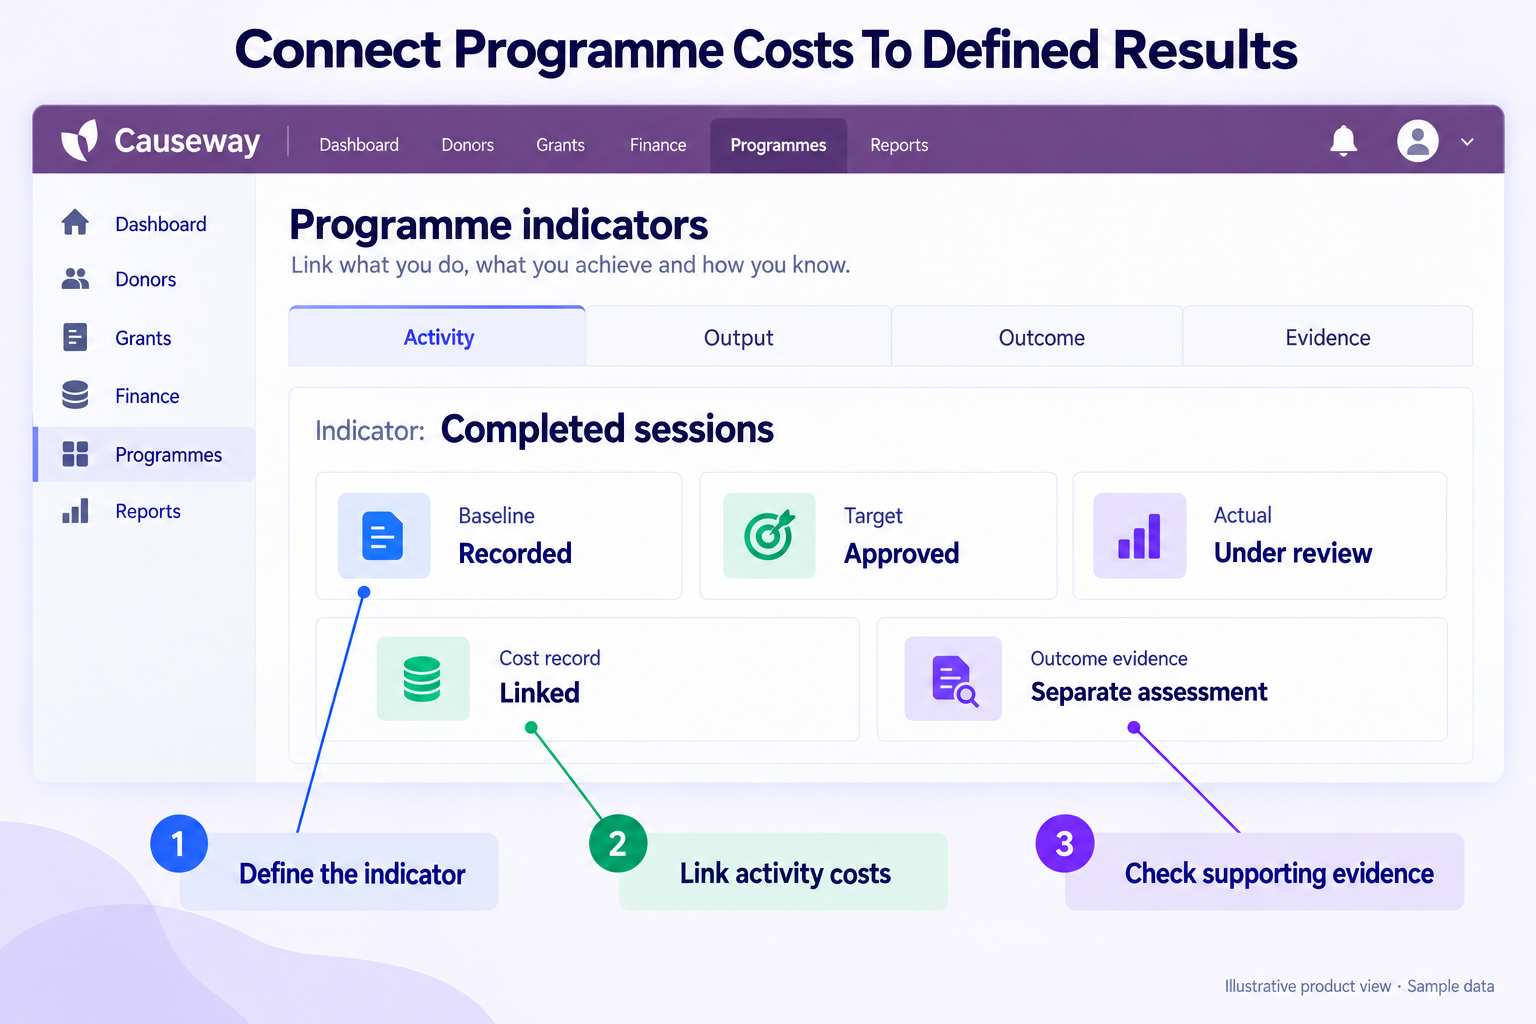
An indicator needs more than a name. Specify its unit, inclusion rule, period, collection method, owner and treatment of missing data. A percentage additionally needs a numerator and denominator drawn from compatible populations.
| Indicator Element | Example Definition To Agree |
|---|---|
| Unit | Distinct participants, attendances or completed sessions |
| Period | Activity month, grant year or follow-up interval |
| Inclusion | What qualifies as attendance or completion |
| Denominator | Eligible people, enrolled people or respondents |
| Missing Data | Excluded, pending or separately disclosed |
In multi-country programmes, use shared definitions where comparison is intended. Local teams should still record context that affects interpretation. A change in the definition requires version control; otherwise an apparent performance improvement may simply reflect a new counting rule.
Costs and results need a common reporting grain
Direct costs can often be associated with a specific activity. Shared costs require an allocation method that finance and programme owners understand. Document the basis, period and approval rather than distributing costs according to whichever spreadsheet column is available.
Consider an example programme with two activities costing 12,000 and 8,000 units. If an additional 5,000 units of shared coordination cost are allocated equally, the activity totals become 14,500 and 10,500. Another justified basis could produce different totals. The ratio is interpretable only if that basis is visible.
The integration design should identify where costs, activity records and indicator observations originate. Connect them through stable keys and agreed aggregation rules. Joining every expense row to every participant row can multiply both costs and counts even though the source records are individually correct.
Prevent duplicate beneficiary counts
Suppose 80 people attend one activity and 60 attend another, with 20 attending both. There are 140 activity participations but 120 distinct people across the two activities. Adding the activity counts and labelling the result “beneficiaries reached” would be misleading if the intended measure is unique people.
The beneficiary data workflow should support a reviewed identity process while protecting personal information. Programme reports can often use pseudonymous identifiers and aggregate measures rather than exposing names or contact details.
Test joins and rollups with a deliberately small dataset containing overlaps. Check whether totals remain correct when a participant has several visits, an activity has several expenses or an indicator has several observations. Define whether the report counts a person once per period, programme or service category.
Preserve the route from field observation to indicator
An indicator needs provenance: who collected the observation, when it occurred, which form version was used and which validation changed it. Distinguish the activity date from the date a device synchronised. Otherwise, a delayed upload can incorrectly move a completed activity into the next reporting period.
Offline field capture should retain the original submission while a reviewer resolves duplicates or missing values. Record corrections with reasons and preserve the denominator used for each published measure. Late evidence can justify a revised report, but the previously approved version should remain reproducible.
Keep reporting datasets proportionate to their purpose. An analyst comparing programme outcomes may need age bands and locations rather than names and full case histories. Review small groups and unusual combinations for disclosure risk before sharing results outside the delivery team.
One indicator record with a traceable denominator
For the sample learning programme, indicator IND-01 is “distinct enrolled participants completing at least three sessions during the quarter.” The programme owner approves definition version 1 before collection. Target: 100; baseline: not yet measured; observed completers: 72 of 90 eligible enrolled participants; completion rate: 72 / 90 = 80%. Report the ten-person enrolment shortfall separately from completion. An unmeasured baseline remains unknown rather than zero.
Observation OBS-01 was captured offline on 28 March, received on 2 April and accepted on 3 April after duplicate review. It belongs to the activity period under the stated reporting policy, while the later receipt and acceptance timestamps remain in its history. The linked cost schedule assigns expense references to activity IDs before rolling up to the indicator; it does not join each expense to every participant.
Explain what the numbers cannot prove
Cost per participant can help analyse a defined activity, but comparisons need context. Differences may reflect service intensity, geography, accessibility needs or accounting allocations. A lower ratio is not necessarily a better outcome.
Likewise, observing a change after an activity does not establish that the activity caused it. Attribution requires an evaluation design appropriate to the question. Keep operational monitoring, outcome observation and causal conclusions distinct in both dashboards and narrative.
Review apparent anomalies with programme staff before presenting a ranking. An unusually low cost may indicate missing invoices or an inflated denominator. Show the data period, completeness and allocation basis beside the measure so decision-makers understand what they are comparing.
Trace funding through activities, costs and results with the Grant-to-Impact Data Model.
Conclusion
Start with clear measures and relationships before building a dashboard. Preserve the distinction between spending, activity, output and outcome; document cost allocations; and test duplicate handling with small examples. The resulting reports are more useful because readers can understand both the calculation and the limits of the conclusion.
Connect programme evidence with finance
Evaluate how programme, finance and beneficiary records could connect through Causeway. Bring your indicator definitions, a cost-allocation example and a report whose totals are difficult to reconcile.
Ask for a discussion of identifiers, aggregation rules, privacy boundaries and external monitoring systems. A useful demonstration should show overlapping participants and shared costs without multiplying totals. Confirm which reporting relationships are supported and which require additional modelling or integration work.
Frequently asked questions
Can cost per beneficiary compare every programme?
No. Comparisons require compatible populations, service intensity, periods and cost-allocation methods. Use the ratio as one analytical view, with relevant context. A lower figure can reflect a different service model or incomplete data rather than greater effectiveness.
How should shared costs be allocated?
Use a documented, reviewed basis appropriate to the cost and reporting purpose. Preserve the inputs and period so the result can be reproduced. Check donor conditions and accounting policy where applicable, and disclose the method when it materially affects comparisons.