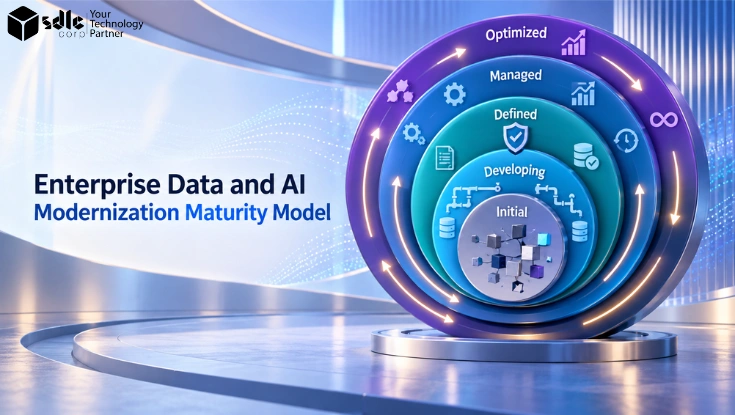
This maturity model is a practical internal diagnostic, not an industry standard. Use it to judge how ready the organization is to deliver data and AI change, where the biggest gaps are, and what should be fixed first.
Use the maturity model to compare current capability with the delivery demands the organization is trying to meet. Define the levels, dimensions, scoring logic, and reassessment rules, and treat thresholds as configurable internal policy rather than universal standards.
Score each of the eight dimensions on the five-level scale, award a level only where observable evidence supports it, read the resulting profile rather than the average alone, and convert the lowest-scoring dimensions into owned actions with a review date.
- A way to compare current capability against intended delivery needs.
- Scores and thresholds you can set as internal policy rather than inherit as a standard.
- An evidence rule that replaces self-reported confidence with named artifacts.
- A route for remediation detail into the roadmap, quality, governance, and architecture pages.
Structured guidance
Convert assessment findings into a budgeted rollout by turning each material maturity gap into a prioritized, costed project. Use the modernization cost planning guide as a companion for consistent sizing and assumptions.
- Summarize each gapState the desired outcome, a measurable success metric, and the minimal viable deliverable (MVD).
- PrioritizeScore gaps by business value, compliance or risk urgency, and technical dependencies, and flag enabling work that must precede others.
- EstimateUse the cost planning guide templates to assign a ballpark cost, duration, required roles, and infrastructure assumptions, including a contingency allowance.
- Sequence into tranchesGroup projects into near-term (Year 1), medium (Year 2), and long-term (Year 3+) tranches and build a dependency-aware timeline for each tranche.
Example: data catalog, high impact, depends on cleanup, estimate $250k, target Year 1. ETL refactor, medium impact, $600k, target Year 2. Model governance framework, required, $100k, target Year 3.
Next step: create a simple spreadsheet with columns for gap, outcome, metric, priority score, estimated cost, duration, nominated owner, tranche, and contingency, then review it with stakeholders to convert the tranche plan into a formal budget request.
Five maturity levels
The five levels run from ad hoc at Level 1 to scaled and improving at Level 5, with emerging, defined and managed in between.
Each level describes how the organization behaves rather than how impressive the tooling sounds. A team with modern platforms and no shared release discipline is not a Level 4 team.
Use the levels to explain what teams can do reliably at each stage. Level 2 supports pilots run with local discipline inside one team.
Level 4 supports repeatable delivery across multiple domains, with clear controls and named run ownership behind every release.
The five levels and the minimum evidence each one requires
| Level | Name | What the organization can do reliably | Minimum evidence |
|---|---|---|---|
| 1 | Ad hoc | Work depends on individuals and local knowledge. Outcomes vary by team. | Tool inventory and informal process notes |
| 2 | Emerging | Pilots run with local discipline inside one team, supported by manual handoffs. | Pilot summaries, handoff trackers, single-team retrospectives |
| 3 | Defined | Standards and shared pipelines are used across more than one team. | Published standards, architecture diagrams, shared CI or CD, data catalog |
| 4 | Managed | Delivery repeats across domains with controls, telemetry and named run ownership. | Telemetry dashboards, SLA reports, automated tests, runbooks |
| 5 | Scaled and improving | Patterns are reused across domains and improvement is measured, not asserted. | Continuous improvement logs, A/B test outcomes, business impact reports |
- Describe each level in terms of real operating behavior.
- Show the difference between pilot capability and scaled capability.
- Avoid treating Level 5 as mandatory for every team or use case.
- Use levels to guide decisions, not to create vanity labels.
Where the levels come from
The level names are not invented here. They follow established maturity and management frameworks, which is useful when a reviewer asks why five levels and not three.
Borrow the structure, keep the thresholds internal. None of these frameworks certifies the score produced by this model.
External frameworks this model borrows from
| Framework | What it covers | What this model borrows |
|---|---|---|
| CMMI | Five-level process maturity model with formal appraisal, administered by ISACA. | The five-level ladder and the rule that a level is awarded against evidence, not intent. |
| ISO/IEC 42001 | Certifiable management system standard for AI, covering policy, roles, risk treatment and continual improvement. | The governance, AI delivery and production operations expectations behind those dimensions. |
| DCAM | EDM Council capability model for data management, structured as components assessed across maturity levels. | The data quality and architecture dimensions, and the artifact-per-capability scoring habit. |
Use the external frameworks when an assessment has to stand up to an auditor or a regulator. Use this model when the organization needs a fast internal read it can act on this quarter.
Eight dimensions
The eight dimensions are a practical checklist, and they match the eight inputs in the assessment tool below so a manual score and a tool score stay comparable.
Strategy covers direction and funding. Data quality covers rules, lineage and shared entities. Architecture covers platform and storage choices. Integration covers interfaces, contracts and orchestration.
Governance covers policy, gates and control evidence. AI delivery covers release discipline for models and AI features. Production operations covers run reliability and incident response. Adoption and value covers business use and measured outcomes.
Keep the scoring simple enough that teams can defend it with evidence.
If a dimension cannot be explained clearly in a few sentences, it is probably too broad for this model and should be split or narrowed.
- Use the dimensions to expose the weak point, not to make the model look complex.
- Ask for evidence in each dimension before assigning a score.
- Keep the meaning of each dimension stable over time.
- Revise the wording if reviewers cannot explain the dimension quickly.
Scoring method
Interactive assessment
Modernization Maturity Assessment
Score the operating maturity of your modernization program across strategy, delivery, governance, architecture, and value realization.
About this assessment
This assessment supports structured planning and high-level scoping. It is not an industry standard, certification, commercial quote, or substitute for formal risk, legal, finance, or procurement review.
Purpose and scope: This interactive tool is a directional planning aid to support structured discussion and high-level scoping. It does not establish a standard, commercial quote, guaranteed outcome, or substitute for a risk, legal, finance, or procurement review.
Permitted uses (examples):
- Internal planning, stakeholder alignment, scoping workshops, and creating high-level roadmaps or gap analyses.
- Exploratory readiness checks or non-binding comparisons to inform further investigation.
- Sharing results with authorized stakeholders under applicable confidentiality controls or NDAs; do not publish outputs as an official legal or contractual statement.
Do not use this tool to:
- Enter personal data, confidential contract text, or regulated data. Use anonymized, aggregated, or synthetic examples when testing the tool.
- Certify legal compliance, produce binding commercial quotes, replace formal procurement processes, or guarantee operational outcomes.
Data handling and privacy constraints: Avoid uploading any PII or regulated datasets. If an assessment needs sample data, use anonymized or synthetic examples.
Follow your organization's data classification and handling policies, and consult the Data Protection Officer or equivalent about data privacy or cross-border transfer risk.
Required sign-offs and reviews:
- Final budgets, procurement decisions, contracts, or commitments require review and sign-off by Finance, Procurement, and Legal.
- Risk acceptance, regulatory compliance, and data protection matters require review by Risk/Compliance and the Data Protection Officer or equivalent.
When in doubt, consult the appropriate enterprise reviewers before taking formal decisions.
- Use current-state evidence, not target-state ambition, when selecting the level for each dimension.
- A lower score in production operations or governance usually limits safe scaling even when strategy looks strong.
Maturity scoring rules
| Rule | How to score | Why it matters |
|---|---|---|
| Evidence first | Do not award a level without observable artifacts such as standards, runbooks, SLAs, or logs. | This keeps the model auditable rather than opinion-based. |
| Lowest proven level | Score each dimension at the highest level fully supported by evidence, not aspiration. | A single advanced pilot does not mean the whole dimension is mature. |
| Gate on control gaps | Treat missing governance, security, or operating ownership as blockers even when other dimensions are strong. | This prevents inflated scores that hide delivery risk. |
| Prioritize by profile | Use the score pattern to identify the next moves, not only the average score. | Profiles explain where investment will unlock multiple dimensions at once. |
The per-dimension evidence required at each level is set out in the matrix under Evidence by level, and the same wording should be used when scoring manually and when reading the tool output.
Worked example (short)
Sample org: AcmeBank
Worked example scores
| Dimension | Score | Evidence (minimum) |
|---|---|---|
| Strategy | 4 | Roadmap doc + exec sponsor |
| Data quality | 3 | DQ rules + dashboard |
| Architecture | 3 | Target-state diagram |
| Integration | 2 | One reusable API template |
| Governance | 2 | Named policy owner for 1 domain |
| AI delivery | 3 | Release checklist + tests |
| Production operations | 2 | Basic alerts + runbook |
| Adoption & value | 3 | Post-release metrics for pilot |
Composite: the unweighted average is 22 divided by 8, or 2.75, which rounds to a baseline of 3. Governance and production operations both sit at 2, below the threshold, so both raise a variance flag.
Next steps: assign named owners to governance and production operations within 30 days, establish the required control evidence such as gates and SLAs, then invest in reusable integration patterns to lift integration from 2 to 3 inside 90 days.
Assessment guidance (detailed scoring rules and calculations)
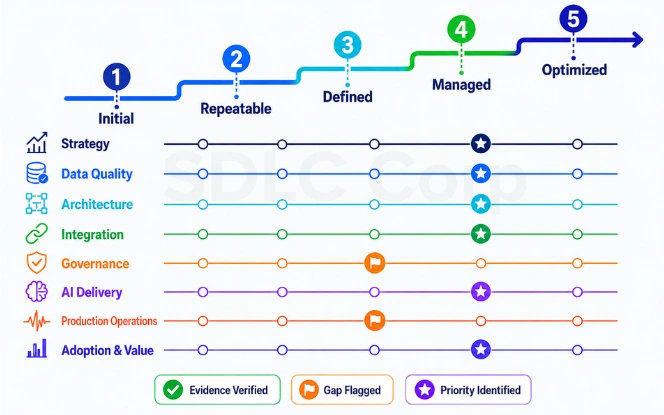
Score each dimension from 1 to 5, where 1 is Initial and 5 is Optimized.
Tie every score to a concrete artifact: an architecture diagram, an SLA, a catalog, a role charter, a pipeline or a business metric. Requiring one named artifact per point removes most of the subjectivity.
Average the unweighted dimension scores for a baseline composite, then apply agreed weights to reflect enterprise priorities. Governance usually carries more weight in a regulated industry.
Record the variance across dimensions as well, so the composite does not hide a low score that will block delivery.
Define thresholds that trigger action. A dimension scoring 1 or 2 gets foundational work and a named owner within 30 days.
A 3 indicates readiness to scale pilots and justifies investment in reusable patterns. A 4 or 5 shifts the focus to automation and cross-domain reuse. Record each decision and its rationale for the next assessment.
- One to five scale: map each score to explicit artifacts or metrics to minimize subjectivity.
- Baseline composite: average dimension scores to produce an initial organization-level maturity number.
- Weighted composite: apply weights to dimensions based on regulatory risk or strategic priorities.
- Variance flagging: surface any dimension below a defined threshold to avoid hidden blockers.
- Action thresholds: formalize next steps tied to score bands with named owners and deadlines.
Score with evidence, compute a weighted composite, and surface low-dimension variance for targeted action.
Evidence by level
Evidence must be explicit and verifiable. The matrix below is the artifact that makes the scoring rules enforceable, because it names the minimum evidence for every level of every dimension.
Read it as a floor, not a ceiling. A dimension scores at the highest level where the named evidence exists and can be produced on request.
Minimum evidence required at each level, by dimension
| Dimension | Level 1 | Level 2 | Level 3 | Level 4 | Level 5 |
|---|---|---|---|---|---|
| Strategy | No documented outcomes | Outcomes written for one priority area | Funded roadmap and investment priorities | KPIs, executive sponsor, decision rights | Portfolio funding and continuous prioritization |
| Data quality | No rules or monitoring | Basic quality rules with ad hoc fixes | Data catalog and quality dashboard | Automated checks against SLA thresholds | Auto-remediation with lineage and SLAs |
| Architecture | No target diagrams | Partial diagrams for key flows | Target architecture document and patterns | Environment decisions and infrastructure automation | Platform standards and cross-team reuse |
| Integration | One-off integrations | Templates for common interfaces | Standard contracts and orchestration | Reusable APIs and a published catalog | Automated onboarding and CI for integrations |
| Governance | No policy owners or gates | Named owners for selected policies | Review gates and control evidence | Exception handling and audit trails | Policy automation and continuous compliance |
| AI delivery | No repeatable delivery path | Use-case intake and a pilot checklist | Release criteria and a test harness | Automated pipelines and validation gates | Continuous delivery with monitored models |
| Production operations | No monitoring or runbooks | Basic alerts and manual runbooks | SLAs and incident playbooks | Automated monitoring and rollback plans | Proactive reliability engineering |
| Adoption and value | No adoption metrics | Adoption tracked for pilots only | Business metrics tied to releases | Behaviour-change programs and review cycles | Value dashboards and continuous optimization |
Where a cell has no matching artifact, the dimension does not reach that level, however convincing the demo was.
Collect evidence from several sources and keep it with the diagnostic output. Useful sources include platform logs, deployment histories, catalog exports, compliance reports and minutes showing executive approval.
Where evidence is missing, log the specific artifact to produce in the next cycle and assign an owner. Absence of evidence is actionable debt, not an assumption of competence.
When teams disagree on how to read an artifact, use a light arbitration step: a two-person panel of a technical lead and a business sponsor.
The panel checks artifacts against the matrix and records the rationale. Keeping the evidence set auditable supports third-party assessment and consistent reassessment later.
- Score the dimension, not the best project inside it.
- Produce the named artifact or drop to the level below.
- Date every artifact so reassessment can show movement.
- Resolve disputes through the two-person panel, and record why.
Treat missing evidence as modernization debt and assign owners to produce required artifacts within a defined window.
Common maturity profiles
DimensionStrategy
Priority gapConvert target state into funded portfolio rules
- Sample score
- 3
- Evidence snapshot
- Approved modernization target state and quarterly steering review
DimensionData
Priority gapStrengthen reusable data-product ownership
- Sample score
- 2
- Evidence snapshot
- Catalog exists, but domain-owned products and SLAs are inconsistent
DimensionArchitecture
Priority gapReduce exception-driven designs
- Sample score
- 3
- Evidence snapshot
- Reference patterns exist for integration and storage
DimensionGovernance
Priority gapOperationalize control ownership and exceptions
- Sample score
- 2
- Evidence snapshot
- Policies exist, but approvals and evidence handling are manual
DimensionDelivery
Priority gapStandardize release gates across more teams
- Sample score
- 3
- Evidence snapshot
- Shared CI or CD exists for core products
DimensionOperations
Priority gapPublish product-level SLOs and incident routines
- Sample score
- 2
- Evidence snapshot
- Monitoring exists, but SLOs and runbooks are uneven
DimensionAdoption
Priority gapTrack workflow adoption and change outcomes
- Sample score
- 2
- Evidence snapshot
- Training and enablement are project specific
DimensionValue
Priority gapTie value reporting to portfolio reprioritization
- Sample score
- 3
- Evidence snapshot
- Use-case ROI is measured for a few products
Enterprises tend to fall into recognisable profiles, and the profile is more useful than the average score for deciding what to do next.
The score pattern names the shape of the problem. The table below sets out the five profiles that come up most often.
Every profile trades one strength against a gap. A Data-Led organization delivers insight quickly and carries access risk while governance lags behind.
A Governance-First organization holds compliance risk down and pays for it in delivery speed. Use the profile to pick one or two priority workstreams rather than a general improvement programme.
Profiles change as investments land. Track the shift after each assessment and map the movement back to the specific investment that caused it.
A Pilot-Heavy organization that funds shared pipelines and standard schemas should reach Defined, then Managed, provided adoption is enforced and value is measured.
Five recurring profiles and the first move each one calls for
| Profile | Typical signature | Main risk | First move |
|---|---|---|---|
| Data-Led | Strong catalog and analytics, weak governance and delivery standardization. | Uncontrolled access to well-organized data. | Add control ownership and release gates before widening access. |
| Governance-First | Policies and controls in place, low adoption and limited automation. | Delivery slows until teams route around the process. | Automate evidence collection and shorten approval paths. |
| Pilot-Heavy | Many proofs of concept, few repeatable deployment practices, thin telemetry. | Prototypes never reach production. | Standardize pipelines and publish release criteria. |
| Legacy-Dominated | Monolithic systems, manual operations, high technical debt. | Change cost blocks every initiative regardless of intent. | Fund reusable integration patterns and targeted decomposition. |
| Cloud-Native Emerging | Platform automation exists, business adoption and cross-team practice are immature. | Capability outruns usage and value stays unproven. | Invest in adoption tracking and enablement, not more platform. |
Classify your organization into a profile to apply targeted, proven modernization patterns rather than one-size-fits-all fixes.
Prioritisation rules
Prioritization should be rule-based and reproducible. Start with risk: anything that exposes regulatory or financial exposure takes precedence over everything else.
Then apply value criteria such as monetizable outcomes or measurable cost savings. Use dependency analysis so foundational work lands before isolated optimizations.
In parallel, find the quick wins that unlock downstream work, such as an automated ingestion pipeline or a reusable API gateway.
Rank competing items by cost of delay when resources are tight. Every prioritized action needs a named owner, a success metric and a minimum viable deliverable inside the 90-day window.
Run prioritization through a small forum that meets weekly during the first phase of work.
The forum uses scores, risk flags and value estimates to approve or re-order the backlog. Record the rationale so tradeoffs can be explained months later.
- Remediate risk firstPrioritize regulatory or financial risk remediation immediately and assign high-priority status.
- Unlock foundational enablersPrioritize initiatives that unlock multiple dimensions or multiple business units.
- Rank by cost of delayUse cost-of-delay and expected value to rank competing investments with limited resources.
- Take the quick winsIdentify and execute quick wins that enable longer term work such as reusable pipelines.
- Attach ownership to every itemRequire a named owner, metric, and 90-day deliverable for each prioritized item.
Make prioritization rule-based: risk first, then foundational enablers, then high-value and quick-win items.
If the team still needs the plain-language business case behind these maturity gaps, use how data modernization enables enterprise AI before sequencing the next tranche of work.
90-day next-step plan
A 90-day plan should focus on the most important gaps, not every gap. Pick the work that changes delivery confidence fastest: ownership, quality controls, reusable architecture, release discipline, or business adoption support.
Treat the timeline as an example planning window, not a standard. Some organizations will move faster. Others will need longer because the estate, control burden, or staffing model is different.
- Choose a small number of gaps that block real progress now.
- Name the owner, evidence, and review date for each action.
- Use the plan to improve the next score, not only to fill a spreadsheet.
- Adjust the time window when the estate is larger or more regulated.
Scoring governance and reassessment
Consistent scoring needs a charter that fixes the rubric, the evidence requirements and the make-up of the review panel.
Include technology, security, data stewardship and the business so judgment stays balanced. The charter also names who can override a score and what documentation an exception requires.
Reassessment should track business planning cycles while staying frequent enough to catch real change.
A quarterly review through the first year validates the impact of interventions and surfaces regressions early. After that, a semiannual cadence usually holds unless the environment is moving fast.
Automate evidence collection wherever the tooling allows, pulling logs, deployment history and catalog exports straight into the evidence repository.
Where automation is not possible, require a dated artifact and a named owner for the manual item so auditability survives the next staff change.
- Establish a scoring charter with a defined rubric and evidence requirements to reduce subjectivity.
- Review panel should include technical, security, data stewardship, and business representatives.
- Set reassessment frequency from program risk, rate of change, and business planning cycles. A quarterly review during an active transformation can be a useful starting cadence, with less frequent reviews once the operating model stabilizes.
- Automate evidence collection from CI/CD, monitoring, and data catalogs where possible to reduce overhead.
- Require dated artifacts and named owners for any manual evidence items to maintain auditability.
Govern scoring with a charter and regular reassessment cadence to ensure progress and accountability.
Use this model as an internal planning tool, not as an external benchmark. For current cross-industry guidance on AI risk and control structure, see the NIST AI Risk Management Framework and its Govern-Map-Measure-Manage core.
Use the maturity result to plan delivery
The maturity score is a starting point, not the programme. Turn the results into a prioritized roadmap, a control plan and an implementation backlog tied to business objectives.
A companion roadmap template helps, and so does an early conversation with the PMO or the enterprise architecture team about how findings become delivery work.
Frequently Asked Questions
Sufficiency depends on the use case. For low-risk analytics, Defined at level 3 is often enough if data quality and delivery are repeatable.
For regulated or high-stakes AI, aim for level 4 or 5, where governance, telemetry and measured business outcomes are already in place.
Ask the CDO and the business sponsor to confirm sufficiency against the risk and performance requirements for that specific use case.
Yes, and they usually do, because each dimension has a different owner and a different investment profile.
Use the assessment to expose that variance and to prioritize foundational dependencies. If data is strong but uncontrolled, the next investment belongs in governance and delivery.
Assign cross-functional sponsors where two dimensions depend on each other, so one does not become a bottleneck for the other.
Scoring works best as a joint effort led by the chief data officer or equivalent role.
Technical validation comes from the CTO organization and business validation from the sponsoring lines of business. A two-person panel settles disputes, and every piece of evidence has a named owner.
Keep the scoring transparent and documented so it holds up in governance reviews and future audits.
Set the frequency from programme risk, rate of change and the business planning cycle rather than from a fixed rule.
A quarterly review is a reasonable starting cadence during an active transformation, moving to less frequent reviews once the operating model settles.
Automating evidence collection keeps the overhead of each reassessment low enough that the cadence survives contact with delivery pressure.
Publish a prioritized backlog with named owners, success metrics and 90-day deliverables.
Start remediation immediately on any regulatory or high-risk item, deliver one to three quick wins, and build the foundational assets that let the rest of the work scale.
Report progress against the scores at each governance meeting and re-prioritize on outcomes rather than on the original plan.