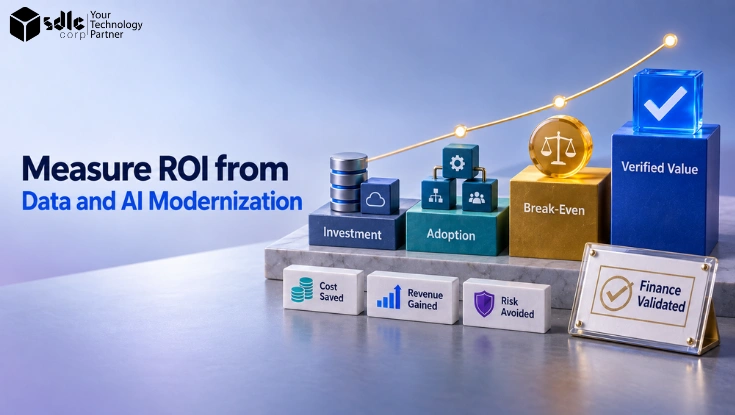
First, recognize that enterprise data and AI modernization programs create value through three separate pathways: technical capability, operational adoption and measurable business outcomes.
Executives should measure each pathway independently. Then, trace realized outcomes to specific investments, owners and time horizons so portfolio decisions are evidence driven and disputes are easier to resolve.
- What You Will Decide Help executives and programme leaders define credible value measures for data and AI modernization investments.
- Why It Matters A benefits-realization method that separates technical progress, adoption and business outcomes instead of forcing all value into a single ROI percentage.
The decision facing leaders is not whether to modernize but how to measure whether modernization delivers business results.
Treat modernization as a set of hypotheses about decisions you expect teams to make differently because of better data, faster models or more reliable automation. Each hypothesis requires a clear value pathway, baseline, owner and timebox for validation.
As a result, technical metrics are less likely to be mistaken for business value.
Therefore, the measurement approach separates technical progress, adoption, and outcomes. First, build a value tree that links platform capabilities to revenue, cost, risk, and experience outcomes.
Next, establish baselines and control logic, define leading and lagging KPIs, assign benefit owners, and validate realized benefits through finance and operational evidence. Consequently, the approach reduces arguments about attribution and supports prioritized investment across foundational and scaling workstreams.
Finally, the conclusion summarizes implementation options and suggested next steps.
Modernization ROI cannot be reduced to one technology metric
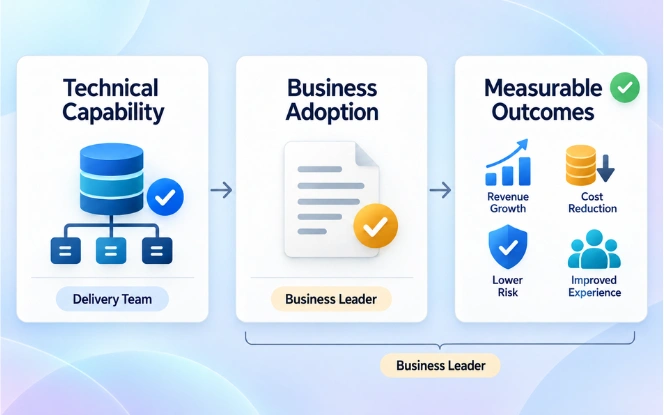
However, a single ROI number hides important differences. Modernization creates value along three distinct paths: technical capability, business adoption, and measurable outcomes. Therefore, report those paths separately to make attribution and progress clear.
For example, a platform can be delivered on schedule. However, it may produce measurable value only after users adopt new workflows and processes.
Practical recommendation: assign separate owners for delivery metrics and for business metrics so each path is tracked and accountable.
- Track technical delivery, adoption, and business outcomes on distinct dashboards.
- Assign distinct owners: delivery teams own delivery metrics; business leaders own adoption and outcome metrics.
Start with a value hypothesis, not a platform target
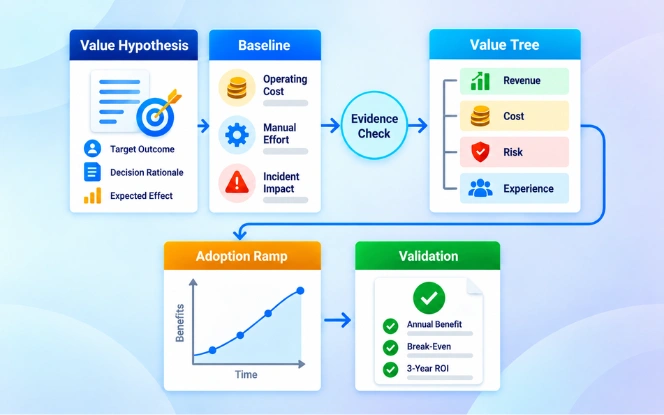
Start with a value hypothesis that names the decision expected to change. Keep it specific: who will use the capability, what action will change, which metric will move, and what evidence would justify scaling.
Therefore, teams are less likely to measure platform activity as if it were business value. If the decision and expected effect are unclear, the ROI story is not ready either.
- Name the user, the decision, and the expected effect.
- Define the evidence needed before development begins.
- Use a control or comparison approach where possible.
- Reject vague hypotheses that only restate technical progress.
Build a value tree across revenue, cost, risk and experience
Next, use the interactive ROI calculator to translate a modernization case into estimated annual benefit, break-even timing, and three-year ROI across conservative, expected, and optimistic scenarios.
Specifically, the calculator uses baseline run costs, manual-processing effort, incident impact, expected reductions, top-line improvement, implementation costs, platform costs, and benefit timing.
Finally, it reports steady-state and year-one benefits, break-even timing, and scenario ROIs to support program prioritization.
Modeling guidance: Separate operating-cost, manual-processing, and incident-cost reductions rather than applying a single percent to every cost base, and model a monthly adoption ramp so year-one value reflects adoption and change rather than assuming a full-year benefit immediately.
Typical Planning Assumptions
Use these calculator defaults only as typical planning assumptions. They are starting points for scenario design, not industry benchmarks or promised results. Replace each value with an evidence-based estimate approved by the benefit owner and finance.
Typical modernization ROI planning assumptions
| Benefit stream | Default | What to validate |
|---|---|---|
| Operating-cost reduction | 12% | Recurring run-cost savings after implementation and adoption |
| Manual-processing reduction | 22% | Automation, fewer reconciliations and reduced analyst rework |
| Incident-cost reduction | 18% | Fewer incidents, shorter outages and faster recovery |
| Typical payback range | 12–24 months | Implementation timing, adoption ramp, recurring costs and the point when cumulative net benefits recover the initial investment |
Interactive calculator
Data and AI Modernization ROI Calculator
Translate a modernization case into estimated annual benefit, break-even timing, and three-year ROI across conservative, expected, and optimistic scenarios.
About this assessment
This calculator is a directional planning model. It is not a commercial quote, guarantee, or substitute for finance, legal, risk, or procurement review.
Review The ROI Results
- This model separates operating-cost, manual-processing, and incident-cost reductions instead of applying one percentage to every cost base.
- Monthly benefit ramps after implementation so year-one value reflects adoption timing instead of assuming a full-year benefit immediately.
Map Capabilities To Value Branches
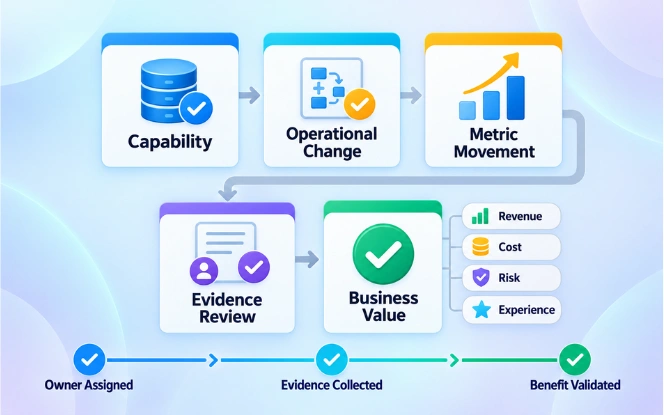
First, a value tree maps capabilities to revenue growth, cost reduction, risk avoidance, and experience improvement. Then, it connects each capability to intermediate operational changes and the final outcome.
For example, a master data capability can enable faster quote response, which increases win rate and reduces sales cycle time. The tree makes intermediate assumptions explicit for later validation.
Next, use the value tree as a decision tool during backlog prioritization. For example, rank candidate work by pathway clarity, impact size, and attribution confidence.
Consequently, projects that enable several value branches or remove critical blockers often deserve priority and scaled funding.
Document Ownership And Validation Triggers
A review-ready value tree records the capability, operational metric, outcome metric, owner, and validation trigger for each branch. Use the value tree in programme reviews to connect each capability to an operational metric, business outcome, accountable owner, and validation trigger.
As a result, benefit attribution becomes easier to review, and double-counting across workstreams declines.
Modernization value tree
| Value branch | Capability | Operational change | Outcome metric | Owner | Validation trigger |
|---|---|---|---|---|---|
| Revenue | Trusted customer and product data | Faster, more accurate offers | Win rate; incremental revenue | Sales leader | Lift persists in an approved cohort |
| Cost | Automated data and AI workflow | Less rework and manual handling | Cost per transaction; hours avoided | Operations leader | Payroll or vendor spend reconciles |
| Risk | Governed controls and monitoring | Earlier detection and faster recovery | Incident frequency; loss avoided | Risk owner | Incident evidence confirms sustained change |
| Experience | Unified data and decision support | Faster, more consistent service | Resolution time; satisfaction; retention | Experience leader | Service and customer measures improve together |
- Map capability to operational change to final business metric for each branch.
- Prioritize work with clear, multi-branch impact and high attribution confidence.
- Capture owners and validation triggers alongside each branch for accountability.
- Use the value tree to reconcile portfolio activity with expected financial outcomes.
A value tree makes the causal path from platform capability to business result explicit and auditable.
Establish a credible baseline
A credible baseline uses measured data, clear sources, and explicit assumptions. Where possible, compare against a control group, a prior period, or another defensible reference point so the team can explain why the change happened.
However, keep the baseline practical. The goal is not statistical perfection for every use case. Instead, aim for a number that finance and operating leaders can challenge without finding hidden gaps immediately.
- Use measured data with named owners and source systems.
- Document the assumptions that make the baseline usable.
- Prefer comparison designs that help isolate the effect.
- Update the baseline if scope or operating context changes materially.
In addition, use the NIST AI Risk Management Framework and its Measure and Manage core functions as an external baseline for measurement, monitoring, and ongoing risk review.
Financial Measurement Sources
Moreover, use established methods to challenge benefit, cost, timing and uncertainty assumptions. For example, the following sources support risk adjustment, reference-class comparison, lifecycle cost estimating and discounted benefit-cost analysis.
- Forrester Total Economic Impact methodology for costs, benefits, flexibility and risk.
- McKinsey and Oxford research on large IT projects for reference-class risk and value shortfalls.
- U.S. GAO Cost Estimating and Assessment Guide for baselines, sensitivity analysis, risk and actual-cost updates.
- OMB Circular A-94 for discounted net benefits, uncertainty and benefit-cost analysis.
Separate leading and lagging indicators
First, measure progress with leading indicators that signal future outcomes and lagging indicators that confirm value. For example, leading indicators include adoption rate, model inference latency, data pipeline throughput and feature readiness.
Meanwhile, lagging indicators include revenue, cost per transaction, compliance incidents and customer satisfaction. Therefore, report both sets to show progress and maintain accountability for eventual outcomes.
Connect Early Signals To Business Outcomes
Define the causal link that ties leading indicators to lagging outcomes for each hypothesis. For example, increasing active users of a decision support dashboard is a strong leading indicator for faster approvals, which should reduce cycle time and increase throughput.
As a result, explicit linkage makes it easier to escalate when leading signals diverge from expected outcomes.
Set Targets And Review Cadence
Next, use a responsive KPI table to track indicators by value branch and owner. In addition, include target ranges and the review cadence.
Consequently, program leaders can spot early signs that a capability will not produce the intended benefit. They can then strengthen adoption work or reallocate investment to higher-probability outcomes.
Leading and lagging modernization indicators
| Value branch | Leading indicator | Lagging indicator | Owner | Review cadence |
|---|---|---|---|---|
| Revenue | Active users; recommendation acceptance | Win rate; incremental revenue | Sales or product | Weekly leading; monthly lagging |
| Cost | Workflow completion; automation rate | Cost per transaction; net hours saved | Operations | Weekly leading; monthly lagging |
| Risk | Control coverage; alert response time | Incident frequency; realized loss | Risk or security | Weekly leading; quarterly lagging |
| Experience | Response latency; first-contact completion | Satisfaction; retention; resolution time | Customer experience | Weekly leading; monthly lagging |
- Define leading indicators that predict downstream outcomes for each hypothesis.
- Pair each leading metric with the lagging business metric it is expected to influence.
- Set target ranges and review cadence for early detection of divergence.
- Escalate and reallocate when leading indicators fail to materialize as planned.
Leading indicators let you act before outcomes are final; lagging indicators confirm realized value.
Measure adoption and process change
Because adoption is the gateway between capability and outcome, track active user counts, workflow completion rates, and override frequency.
In addition, combine telemetry with targeted surveys and sample audits to understand why users accept or reject recommendations. Consequently, teams can target UX changes, retraining or policy adjustments.
Measure End-To-End Process Change
Next, measure process change by tracing end-to-end workflow steps and cycle time before and after deployment. Then, look for better handoffs, fewer rework loops and reduced manual intervention.
Where automation reduces steps, quantify the saved labor and residual maintenance work. Therefore, benefit claims will reflect the net effort reduction.
Allow For Behavioral Lag
However, account for behavioral lag when validating adoption. Some users will take time to change routines, and adoption campaigns may be necessary.
Therefore, set phased adoption targets and correlate adoption milestones with expected business outcomes. This approach avoids recognizing benefits before behavior stabilizes and results become durable.
- Track active usage, workflow completion and override frequency as primary adoption metrics.
- Combine telemetry with surveys and audits to diagnose adoption barriers.
- Quantify net labor reduction by measuring eliminated steps and residual maintenance work.
- Set phased adoption targets and tie them to outcome recognition rules.
Without sustained adoption, even technically successful capabilities generate little business value.
Validate realized benefits
First, validation requires operational and financial evidence. For cost savings, reconcile engineering reports with payroll or vendor billing to show net avoided spend. Similarly, use control groups or lift analysis to isolate incremental revenue.
Similarly, for risk reduction, document the incident frequency and severity avoided. Then map that change to measurable cost avoidance.
Benefit validation evidence and finance treatment
| Benefit type | Evidence required | Finance treatment |
|---|---|---|
| Cost savings | Engineering reports reconciled with payroll or vendor billing to confirm net avoided spend | Recognize as recurring operating savings only after the cost leaves the approved budget or run-rate forecast |
| Incremental revenue | Control-group or lift analysis that isolates revenue attributable to the capability | Recognize as incremental revenue after finance validates attribution, timing and margin assumptions |
| Risk reduction | Documented change in incident frequency or severity linked to measurable loss avoided | Report as validated cost avoidance unless an actual expense, provision or loss estimate changes |
Align Benefit Recognition With Finance
Involve finance early to define acceptable evidence for recognizing benefits. Next, agree whether benefits count as operating savings, capitalized improvements, or a one-time adjustment.
As a result, the program can prevent later restatements and align reporting with corporate accounting rules. In addition, keep an audit trail of the data and calculations used to recognize each benefit.
Maintain A Reviewable Evidence Trail
During each review, use a validation checklist covering attribution logic, data integrity, financial reconciliation, and owner signoff. Also, document timing assumptions for recurring and one-off benefits.
Finally, retain this checklist in the program archive for internal audits and future governance reviews.
- Reconcile operational metrics with finance records for cost and revenue validation.
- Use lift analysis or control groups to isolate incremental revenue.
- Agree with finance on how benefits will be classified and recognized.
- Apply a validation checklist with signoff from owners and finance for each benefit.
Validated benefits require both operational evidence and finance reconciliation before they are posted.
Manage modernization as a value portfolio
First, treat the program as a portfolio of investments with different risk, time horizon and confidence profiles. Then, group the work into foundational infrastructure, quick wins, and scale bets.
Then allocate funding and governance weight according to the clarity of the value pathway and expected validation time.
Balance Foundations With Rapid Tests
At the same time, balance runway work that reduces systemic risk with tightly scoped experiments that can prove business cases quickly.
For example, use the value tree to show how foundational investments unlock multiple downstream outcomes. Then reserve part of the budget for rapid tests that either fail fast or scale with validated benefits.
Reprioritize The Portfolio Quarterly
Next, use portfolio metrics to guide quarterly reprioritization. Track weighted expected value, probability of success, and investment liquidity across projects.
Finally, reallocate resources from low-probability, long-tail projects to nearer-term validated opportunities. However, preserve essential strategic capabilities that take longer to monetize.
- Classify work into foundational, quick-win and scale investments with different governance rules.
- Allocate budget proportionally to expected value, confidence and time horizon.
- Reserve funds for rapid experiments that can provide early validation or fail fast.
- Use portfolio metrics to inform periodic reprioritization and reallocation.
A portfolio view ensures the program balances durable foundations with testable, near-term value.
Frequently Asked Questions
However, the time to measurable benefits varies by work type. For example, quick experiments can produce evidence in weeks, while platform foundations and new revenue streams can take quarters.
Use leading indicators to signal progress early and set phased validation gates so benefits are recognized only after adoption stabilizes and finance has reconciled the numbers.
However, engineering metrics are enabling signals, not direct ROI. Therefore, report them alongside a clear link to business outcomes.
Only count benefits in financial reports after operational changes are validated and finance has confirmed reconciliation with payroll, billing or revenue records.
First, finance must agree on the baseline method, benefit classification, and evidence required for recognition.
Early involvement avoids later disputes, ensures compliance with accounting rules and provides a single source of truth for program performance when benefits are posted to budgets or financial statements.
Document ownership and attribution rules in the value tree and validation checklist. During reconciliation, map each recognized saving or incremental revenue to the owning project and adjust overlapping claims. Use a governance board to adjudicate disputed attribution with predefined rules.
When historical data is incomplete, document proxy measures, data gaps and the impact on confidence. Use synthetic controls or phased baselines starting with high-confidence cohorts. Get finance and data owners to sign off on the chosen approach before recognizing benefits.