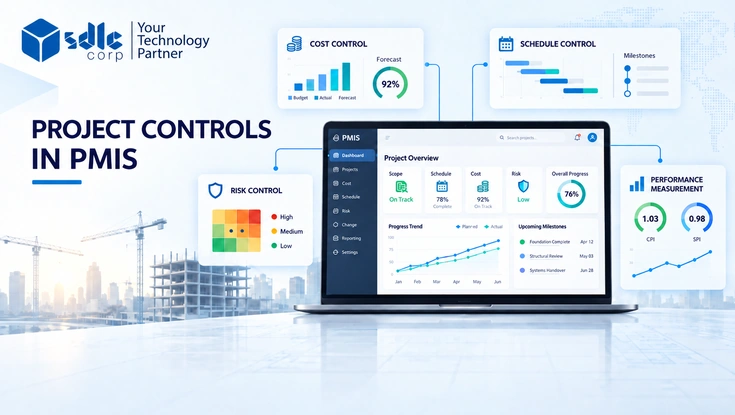
Project controls in a Project Management Information System (PMIS) turn project data into decisions. They connect approved scope, budgets, schedules, risks, contracts, changes and actual progress so teams can see where a project stands, where it is likely to finish and what action is needed next.
That is why the distinction matters. In practice, a PMIS should do more than store reports or display a dashboard. Instead, it should provide a controlled flow of information from the work breakdown structure to the forecast, while preserving the assumptions, approvals and audit trail behind each number.
For project owners, PMO leaders and project controls teams, the goal is not more data; instead, it is earlier warning, more reliable forecasts and clearer accountability.
What Are Project Controls in a PMIS?
In general, project controls are the processes used to establish a plan, measure actual performance, forecast outcomes and manage corrective action. Inside a PMIS, those processes share one data model instead of operating through separate spreadsheets and disconnected applications.
In particular, a working project controls system should answer five practical questions:
- Which work has been approved?
- What should that work cost, and when should it happen?
- How much work has actually been completed and spent?
- Which risks or changes could alter the outcome?
- When is the project currently forecast to finish?
The PMIS then supports those answers by linking scope, cost, schedule, risk and performance records. It also controls who can enter, approve and change information. As a result, this creates a traceable record for project teams, executives, auditors and funding stakeholders.
For a closer look at access design, see our guide to PMIS Security: Roles, Permissions and Governance, which explains how to set these rules by role.
PMIS, Project Management Software and Project Controls Are Not the Same
Although these terms are often used as if they mean the same thing, they do not.
| Term | Primary purpose | Typical capabilities |
|---|---|---|
| Project management software | Coordinate tasks and team activity | Tasks, assignments, calendars, files and collaboration |
| Project controls | Measure and forecast delivery performance | Baselines, budgets, cost reports, schedules, EVM, risk and change control |
| PMIS | Provide a governed system of record for project information | Project controls, contracts, documents, workflows, reporting, integrations and audit history |
For example, a task-management tool can show that an activity is 70% complete. However, a project controls process tests whether that progress is supported by objective evidence, whether the cost is proportionate to the work completed and whether the remaining duration is realistic. Finally, a PMIS preserves that information and connects it to the wider project record.
Organizations evaluating the broader platform can use this PMIS selection guide for capital construction projects to compare operational requirements before comparing vendor features.
The Project Controls Cycle
Overall, effective project controls follow a repeatable cycle. The software matters, but the control discipline matters more.
Define the Control Structure
First of all, create a work breakdown structure (WBS) that divides the approved scope into manageable components. Then align it with the cost breakdown structure, organizational responsibilities, contract packages and schedule activities.
As a result, this alignment creates a common coding structure. Otherwise, the schedule may group work by activity, finance may group it by account and procurement may group it by contract. The reports can look complete while describing different versions of the project.
Establish the Baseline
After that, approve the scope, time-phased budget and schedule that will be used to measure performance. Also record the assumptions, exclusions, contingency position and approval date.
However, a baseline is not simply the latest plan. Instead, it is the authorized reference point. Therefore, changes to it should follow a controlled approval process so poor performance cannot be hidden through routine replanning.
Capture Actuals and Progress
Then collect actual costs, commitments, quantities, hours, milestone status and physical progress from their authoritative sources. For example, financial actuals may come from an ERP, schedule status from Primavera P6 or Microsoft Project, and field progress from mobile or site systems.
The PMIS should validate reporting dates, coding, units and approval status before the data reaches an executive dashboard.
Measure Variance and Forecast Outcomes
To begin with, compare actual performance with the approved baseline. After that, identify material cost, schedule and productivity variances. Then update the estimate to complete and expected finish date using current evidence rather than the original plan.
Decide and Act
At this point, assign corrective actions, owners and due dates. Then, if the response changes scope, budget, schedule or contingency, route it through change control. Consequently, the next reporting cycle should show whether the action improved the forecast.
In short, this closed loop separates a project controls system from passive reporting. While a report identifies a problem, a control system also records the decision and tests whether it worked.
Build a Reliable Data Foundation Before Building Dashboards
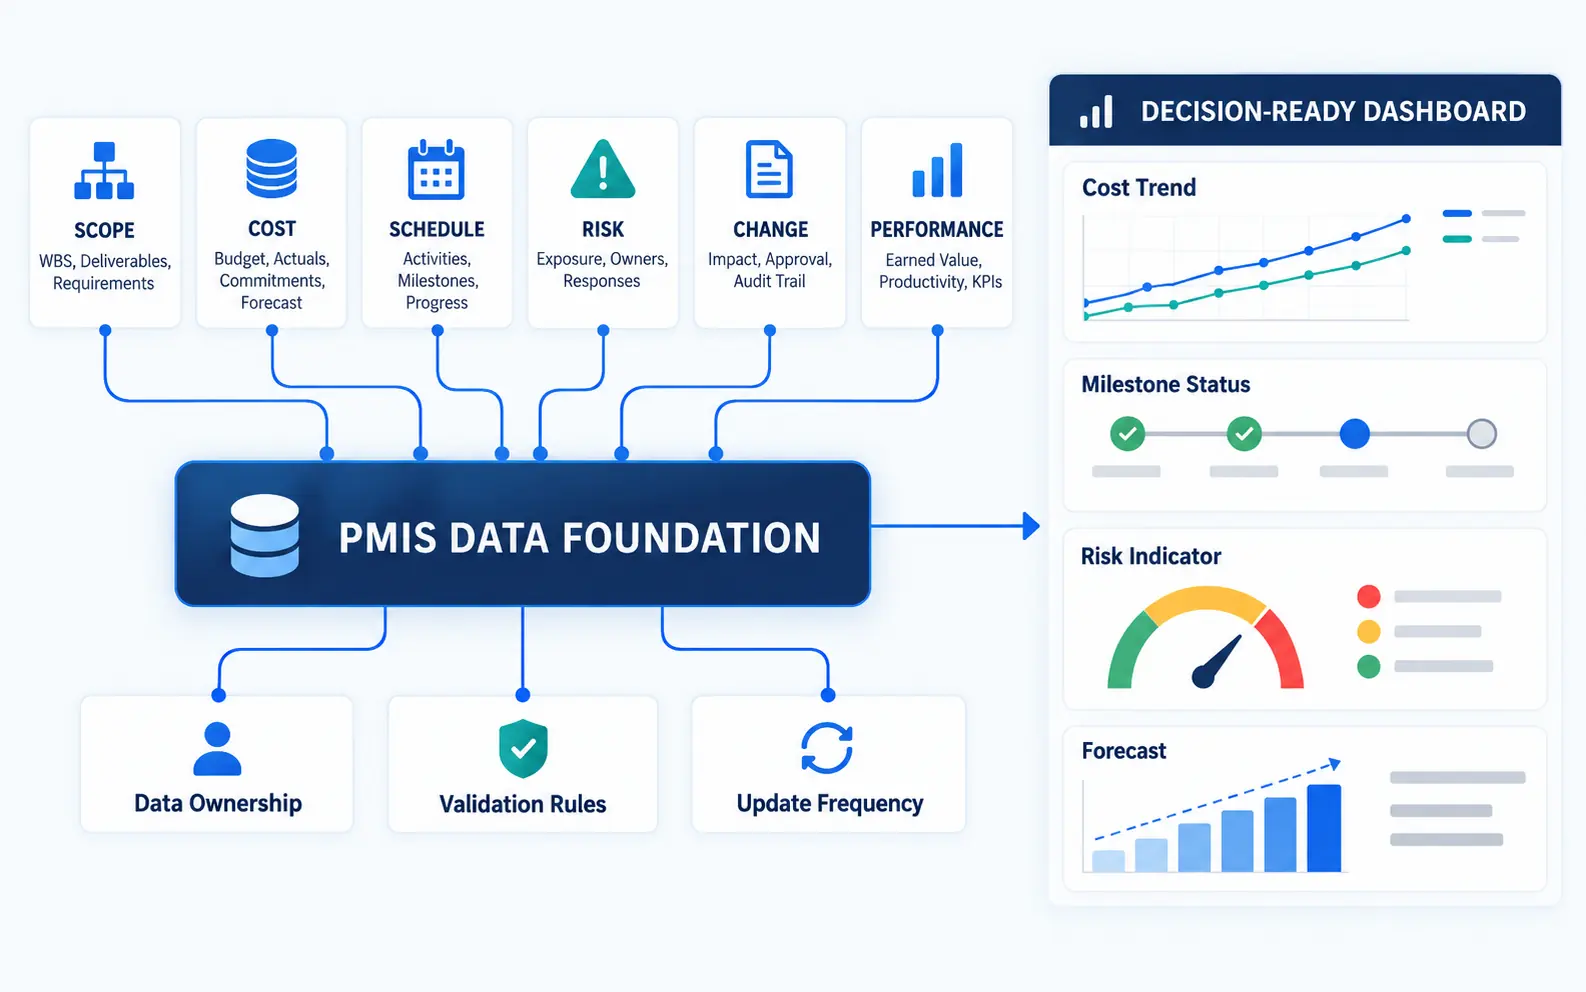
Because dashboards cannot correct weak source data, define the records, owners and update rules that support each measure before designing charts.
| Control area | Core records | Typical system of origin | Key validation |
|---|---|---|---|
| Scope | WBS, deliverables, requirements | PMIS or requirements system | Approved scope and clear acceptance criteria |
| Cost | Budget, commitments, actuals, accruals, forecast | ERP and PMIS | Matching codes, reporting period and currency |
| Schedule | Activities, logic, milestones, calendars, progress | Scheduling application | Valid logic, status date and baseline comparison |
| Risk | Risks, causes, impacts, owners, responses | PMIS or risk tool | Named owner, quantified exposure and review date |
| Change | Change request, reason, impact and approval | PMIS | Combined cost, schedule, scope and risk assessment |
| Performance | Quantities, earned value, productivity and KPIs | PMIS, field and finance systems | Agreed calculation and evidence source |
In addition, every KPI should have a definition, formula, data owner, source, update frequency and threshold. As a result, this prevents two departments from using the same label for different calculations.
Cost Control in a PMIS
Cost control begins with an approved budget, but it does not end with budget-versus-actual reporting. Instead, project leaders need to understand current obligations and the likely final cost.
Create a Time-Phased Cost Baseline
To begin with, allocate the budget to control accounts or work packages and distribute it across the planned delivery period. Time phasing then allows the team to compare planned expenditure and earned progress with actual results.
The baseline should also distinguish direct costs, indirect costs, management reserve and project contingency. Because these categories serve different purposes, they should not be combined into one untraceable allowance.
Track the Full Cost Position
In particular, a useful cost report includes:
- Original and current approved budget
- Approved and pending changes
- Commitments and purchase orders
- Actual costs posted from finance
- Accruals for work received but not yet invoiced
- Estimate to complete (ETC)
- Estimate at completion (EAC)
- Variance at completion (VAC)
- Available and allocated contingency
For example, looking only at paid invoices understates exposure. A project can appear under budget even when contracts and pending changes have already consumed the available funding.
Use Forecasts as Management Estimates
Moreover, forecasts should reflect remaining quantities, current productivity, supplier commitments, known changes and active risks. In other words, they should not automatically equal the remaining budget.
The GAO Cost Estimating and Assessment Guide specifically describes reliable cost estimates as comprehensive, well documented, accurate and credible. Those characteristics also provide a useful test for project forecasts inside a PMIS.
Set Cost Thresholds That Trigger Action
Thresholds should identify exceptions but should not overwhelm the team. A control account might require explanation when its forecast moves beyond an agreed percentage or monetary value. However, high-risk projects may need tighter limits.
The PMIS should then record the explanation, proposed response, owner and approval. Otherwise, a red indicator without a management response is only decoration.
Schedule Control in a PMIS
Schedule control tests whether the remaining work can be completed by the required date. Therefore, it depends on sound logic, consistent progress updates and realistic duration estimates.
Maintain a Logic-Driven Schedule
First of all, a reliable schedule connects activities through dependencies. It also identifies the critical path, near-critical paths, milestones, constraints, calendars and available float.
The GAO Schedule Assessment Guide similarly groups schedule quality around ten leading practices. For example, these include capturing all activities, sequencing work, assigning resources, establishing duration, confirming the critical path, testing schedule risk and maintaining a baseline.
Control the Status Date
In addition, each reporting cycle needs a defined status date. Accordingly, actual starts, actual finishes, remaining durations and physical progress should be updated to that date. Moreover, activities should not remain in the past without an actual result or continue into the future without a revised forecast.
The PMIS can flag invalid dates, missing logic, excessive constraints, long-duration activities and unexplained float changes before publishing reports.
Connect Schedule and Cost
Similarly, cost and schedule should not be reviewed as separate stories. For instance, a delayed procurement activity may shift cash flow, extend site overheads and affect several downstream work packages. Therefore, a PMIS should show those relationships.
Useful schedule measures therefore include:
- Baseline finish date and current forecast finish
- Milestone variance
- Critical and near-critical activities
- Total float and negative float
- Activities completed as planned
- Look-ahead commitments achieved
- Schedule Performance Index (SPI)
- Schedule risk exposure
SPI is useful, but it should not replace critical-path analysis. A project can report acceptable aggregate performance while a small number of critical activities threaten the completion date.
Risk Control in a PMIS
Risk management becomes more useful when risks are connected to the work they may affect. A standalone risk register often loses relevance because it is not linked to cost accounts, schedule activities, contracts or decisions.
Write Risks as Cause, Event and Impact
Write each material risk as a clear cause, uncertain event and project impact. Connect it to affected work so teams can assess severity, assign ownership and act early. Avoid vague labels that hide the trigger, consequence or required response.
Record Ownership and Response
Assign every material risk to a named owner. Record probability, impact, response, action dates and review dates. Keep ownership separate from response tasks so teams can see who approves actions, who completes them and when escalation is required.
Quantify Cost and Schedule Exposure
Prioritize risks with qualitative ratings, then quantify major cost and schedule exposure when needed. Use project-specific assumptions and scenario analysis to show how uncertainty may affect forecast cost, milestones and completion dates.
Link Risk to Contingency
Link contingency to identified and quantified uncertainty rather than using it as an informal buffer. Keep the risk, approved response, contingency decision and forecast connected so teams can explain changes in expected cost or completion dates.
Performance Measurement and Earned Value
Overall, performance management brings scope, cost and schedule information together. Earned Value Management (EVM) is one established method, especially for large or tightly governed programs.
In particular, EVM compares three values for the same reporting period:
- Planned Value (PV): budgeted value of work scheduled
- Earned Value (EV): budgeted value of work completed
- Actual Cost (AC): cost incurred for the completed work
The U.S. Department of Energy’s EVM performance and forecasting guidance also covers cost variance, schedule variance, performance indices, ETC and EAC.
| Metric | Formula | Interpretation |
|---|---|---|
| Cost Variance (CV) | EV − AC | Positive is favorable; negative indicates cost overrun for completed work |
| Schedule Variance (SV) | EV − PV | Positive is favorable; negative indicates less work completed than planned |
| Cost Performance Index (CPI) | EV ÷ AC | Below 1.00 indicates cost inefficiency |
| Schedule Performance Index (SPI) | EV ÷ PV | Below 1.00 indicates progress behind plan |
| Estimate at Completion (EAC) | AC + ETC | Current forecast of total final cost |
| Variance at Completion (VAC) | BAC − EAC | Expected underrun or overrun against budget at completion |
These metrics are only reliable when progress is measured objectively. Therefore, avoid assigning 90% completion to an activity for several reporting periods. Instead, use weighted milestones, completed quantities, units installed or another defined earning method.
Set CPI and SPI Review Thresholds
An index only helps when everyone knows which value triggers action. Therefore, agree on review bands in the project controls plan before the first reporting cycle, and then apply them to every control account.
Many owners use bands similar to the ones below. However, treat them as a starting point, and tighten them for high-risk or fixed-budget work.
| CPI or SPI value | Status | Required response | Escalation level |
|---|---|---|---|
| 1.00 or higher | On or ahead of plan | Routine reporting; however, review values above 1.10 because they can signal a weak baseline | None |
| 0.95 to 0.99 | Minor variance | Monitor the trend and note the cause in the period report | Control account manager |
| 0.91 to 0.94 | Watch | Written variance explanation and corrective action with an owner and due date | Project manager |
| 0.86 to 0.90 | Escalate | Recovery plan within one reporting cycle, plus an updated EAC and forecast finish | PMO and project controls lead |
| 0.85 or lower | Critical | Formal recovery review, including contingency use and any required change request | Sponsor or executive board |
In practice, a variance triggers escalation when the cumulative CPI or SPI falls to 0.90 or below. It should also move up one level when an index stays in the watch band for three consecutive periods.
Similarly, treat a drop of more than 0.05 in a single period as an early warning, even when the cumulative value still looks acceptable. Because SPI drifts back toward 1.00 near completion, always confirm schedule escalations against the critical path.
Use Leading and Lagging Indicators Together
Lagging indicators describe results that have already occurred, such as cost variance or missed milestones. In contrast, leading indicators show conditions that may affect future results.
| Leading indicators | Lagging indicators |
|---|---|
| Aging decisions and approvals | Cost variance |
| Unresolved design interfaces | Schedule variance |
| Growth in pending changes | Milestones missed |
| Declining planned-versus-completed commitments | Rework cost |
| Risk actions past due | Final forecast movement |
| Procurement dates approaching without approval | Productivity achieved |
Executives therefore need both. In short, lagging measures provide accountability, while leading measures create time to intervene.
What Should a Project Controls Dashboard Show?
However, one dashboard should not serve every audience. Instead, each level needs enough detail to make its decisions without losing the shared source of truth.
Executive and Portfolio View
For example, executives need exceptions, exposure and decisions. Show overall health, forecast cost, completion outlook, contingency, top risks, major changes and decisions required. Also avoid filling the page with activity-level detail.
PMO and Project Controls View
In contrast, the PMO needs trends and data quality. Therefore, include performance indices, forecast movement, milestone variance, float erosion, change aging, risk exposure, contingency usage and reporting compliance.
Project Team View
Meanwhile, delivery teams need specific actions. For this reason, show upcoming milestones, overdue approvals, critical activities, unresolved changes, risk actions, commitments and forecast inputs requiring review.
Above all, every indicator should allow an authorized user to trace the result to its source record. Otherwise, if a user cannot explain why a metric changed, the dashboard is not yet decision-ready.
Integrating Project Controls With ERP, Scheduling and Field Systems
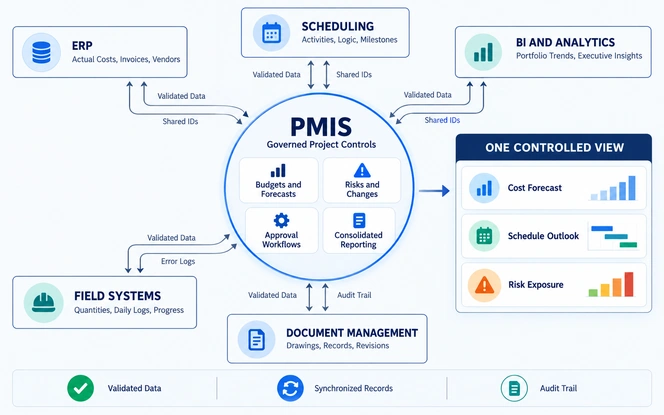
In general, most organizations will not run every process in one application. The PMIS should coordinate authoritative systems rather than create unnecessary duplicates.
For example, a practical integration model may include:
- ERP for general ledger actuals, invoices, vendors and payments
- Primavera P6 or Microsoft Project for detailed scheduling
- PMIS for budgets, changes, risks, workflows and consolidated reporting
- Document management for controlled drawings and records
- Field applications for quantities, daily logs and progress evidence
- Business intelligence tools for portfolio analytics
First of all, define one system of record for each object. After that, decide how frequently data moves, how errors are handled and which identifiers reconcile records across systems. In addition, integration logs should show failures and retries rather than silently dropping transactions.
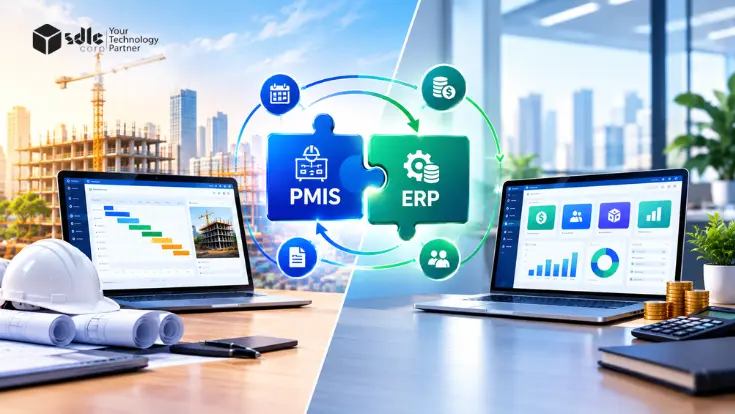
Deciding which platform owns each record is often the hardest part. For that reason, our comparison of PMIS vs ERP explains where each system fits and how they share data.
In addition, for organizations that need a governed platform around specialized workflows, enterprise software development services can support PMIS architecture, integration and modernization requirements that packaged configuration cannot address alone.
Integrated Change Control: Where the Disciplines Meet
Change control, in particular, is the point where scope, cost, schedule, risk and performance must be assessed together.
Therefore, a controlled workflow should:
- Record the proposed change and its reason.
- Identify the affected scope and contracts.
- Estimate cost, schedule and resource effects.
- Review new or changed risks.
- Identify the funding and contingency source.
- Route the change to the correct approval authority.
- Update the baseline only after approval.
- Preserve the original values and full decision history.
Pending changes should be visible in the forecast when they represent credible exposure, even if they have not yet changed the approved budget. Otherwise, decision-makers receive an artificially optimistic picture.
Illustrative Example: Controlling a Capital Upgrade Project
The following scenario is illustrative, so it is not presented as a client result.
In this case, a public owner is delivering a water treatment plant upgrade. The approved budget at completion (BAC) is $48 million, while the baseline duration is 24 months.
Because public owners also manage grants, bonds and audit rules, our guide to PMIS for Public Infrastructure and Capital Improvement Programs covers those extra controls in detail.
At the end of month 10, the PMIS then shows:
- Planned Value: $20 million
- Earned Value: $18 million
- Actual Cost: $19.5 million
- Two critical equipment approvals are four weeks late
- One pending design change has an estimated exposure of $1.2 million
- Schedule risk analysis shows growing uncertainty around commissioning
The project controls team therefore calculates:
- CPI = $18 million ÷ $19.5 million = 0.92
- SPI = $18 million ÷ $20 million = 0.90
- CV = $18 million − $19.5 million = −$1.5 million
- SV = $18 million − $20 million = −$2 million
Therefore, the indices show that the project has completed less work than planned and has spent more than the budgeted value of that completed work. Under the review bands above, the SPI of 0.90 triggers escalation to the PMO, while the CPI of 0.92 sits in the watch band. However, the indices do not explain the cause by themselves.
After that, the team traces the variance to delayed approval, lower installation productivity and the emerging design change. It then models three response options: resequence non-critical work, expedite the approval package or accept a later commissioning date. Each option, however, carries a different cost, risk and schedule effect.
As a result, management approves resequencing and limited expediting. The decision, funding source, owners and revised forecast are then recorded in the PMIS. Meanwhile, the original baseline remains unchanged until any formal change is approved.
Overall, this example shows the value of integration. In other words, cost, schedule and risk indicators create the warning; linked project records explain it; governance turns the analysis into action.
How to Implement Project Controls in a PMIS
Rather than recreating every spreadsheet as a screen, start with the decisions the organization needs to make and work backward to the required data.
Assess the Current Control Environment
First of all, document current processes, systems, reports, approval routes, pain points and data owners. After that, identify duplicate records and manual reconciliations. Finally, agree on the business outcomes that the PMIS must improve.
Define Standards and Governance
Then, set coding structures, baseline rules, progress methods, forecast definitions, risk scoring, change authority and reporting calendars. Also assign ownership for each data domain.
Design the Minimum Viable Control Model
At this point, select the core workflows needed for a pilot. For example, a sensible first release may include project setup, budget, commitments, actual-cost integration, schedule milestones, change control, risks and a limited dashboard.
Configure and Integrate
To begin with, configure workflows and permissions. After that, build integrations around agreed systems of record. Finally, test reconciliation, failed transactions, audit history and access boundaries, not only the happy path.
Pilot With Real Users and Data
Choose a representative project rather than the easiest available project. Then, run at least one complete reporting cycle. Afterward, compare PMIS results with finance and schedule sources, and record the time needed to resolve exceptions.
Roll Out in Controlled Waves
Finally, expand by project type, department or region. Also train users by role and decision, not through a generic feature tour. In addition, track adoption, data timeliness, reconciliation issues and forecast quality after launch.
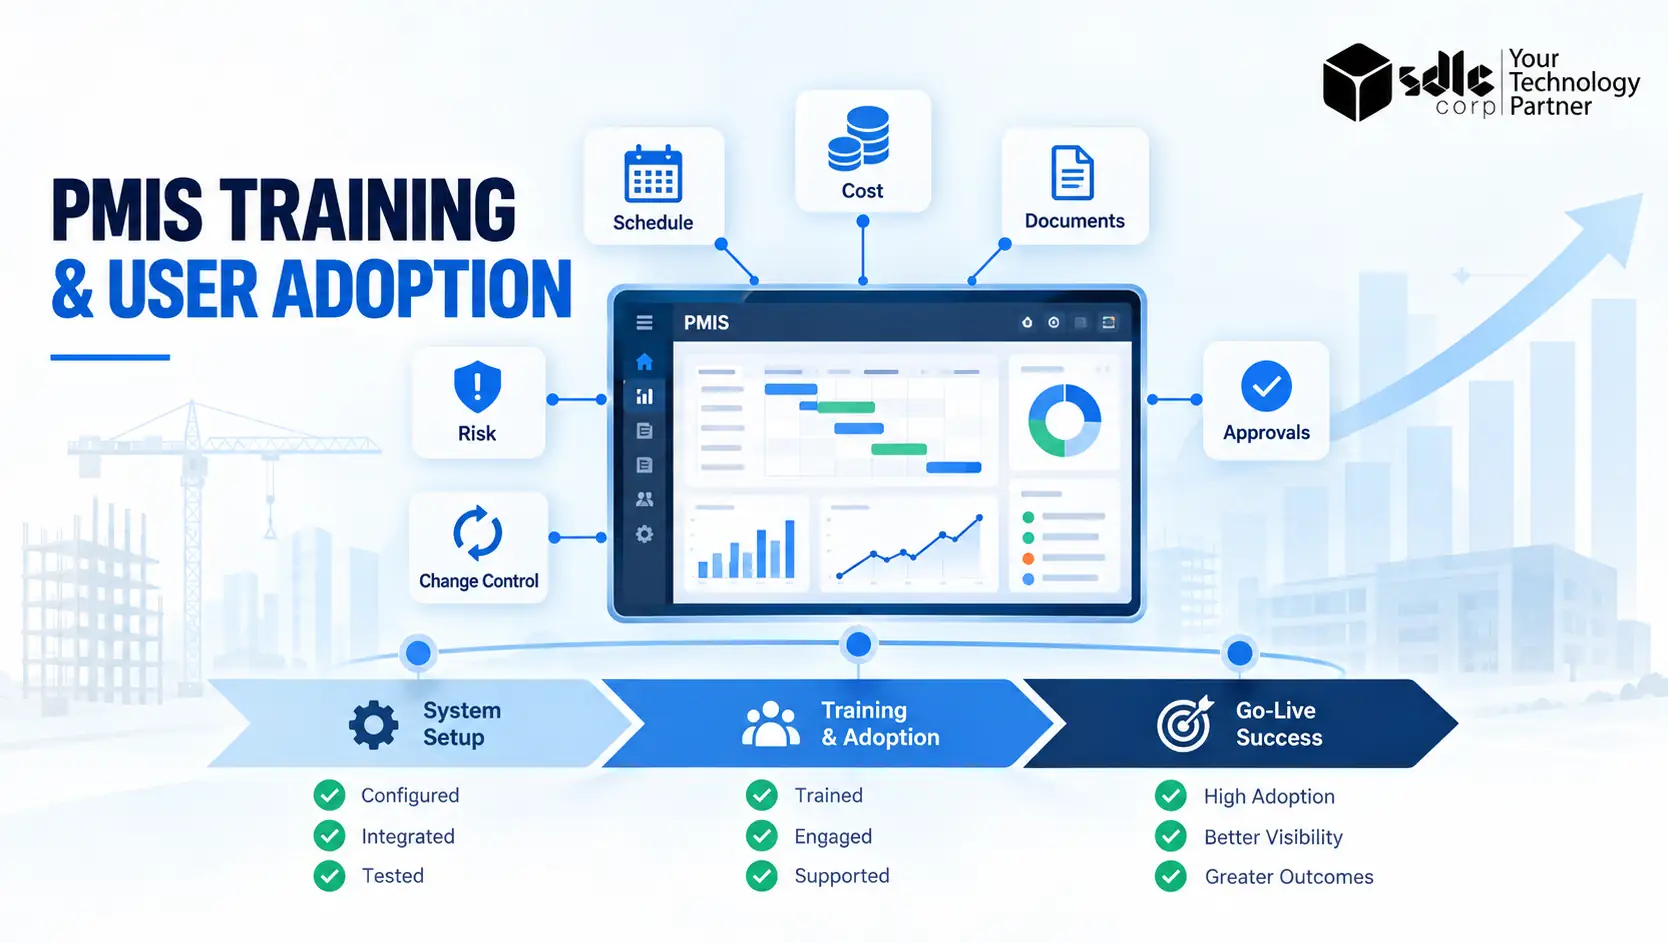
For a role-by-role plan, see PMIS Training and User Adoption: How to Prepare Teams for a Successful Go-Live.
The detailed PMIS implementation roadmap also explains how to sequence readiness, requirements, selection, configuration, migration, pilot testing and go-live.
After launch, our guide to PMIS Support and SLA Best Practices explains what to expect once the system is live.
Common Project Controls Mistakes
Treating the PMIS as a Reporting Layer
When teams prepare information elsewhere and upload a polished monthly report, the PMIS cannot provide timely control. Instead, capture the underlying transactions, status and approvals where practical.
Allowing Multiple Sources of Truth
When finance, scheduling and project teams maintain separate forecasts without reconciliation rules, meetings become debates about whose number is correct. Therefore, assign an authoritative source and owner for every record type.
Measuring Activity Instead of Progress
For example, meetings held, documents uploaded and hours spent are not proof that a deliverable has advanced. Instead, tie progress to measurable outputs and acceptance criteria.
Rebaselining to Remove Variance
Frequent rebaselining, in fact, destroys performance history. For this reason, preserve the original and current approved baselines, and require documented authority for changes.
Publishing Too Many KPIs
Moreover, more measures do not create more control. Instead, select indicators connected to decisions, thresholds and accountable owners. Also retire metrics that no longer change behavior.
Automating a Weak Process
In fact, software can accelerate inconsistent coding, unclear ownership and poor approval design. Standardize the control process before scaling it.
Using AI in Project Controls Without Losing Accountability
AI can support project controls by identifying unusual transactions, summarizing variance explanations, classifying documents, as well as highlighting patterns across cost, schedule and risk data. Predictive models may also help teams identify work packages that deserve earlier review.
However, AI output should not automatically change a baseline, approve a forecast or close a risk. After all, models can reflect incomplete data and historical bias. Instead, keep human approval, source traceability and model limitations visible.
Therefore, the best first uses are narrow and reviewable. For example, an assistant can draft a variance summary from approved records while the project controls lead validates the explanation before publication.
How to Select a PMIS for Project Controls
Evaluate the platform against real control scenarios rather than a generic feature checklist.
In particular, ask vendors to demonstrate how the system handles:
- WBS, cost code and contract alignment
- Original, current and forecast cost positions
- ERP actuals and accrual reconciliation
- Baseline and current schedule comparison
- Risk links to cost and schedule exposure
- Pending and approved changes
- EVM calculations and progress methods
- Forecast history and audit trails
- Role-based access and approval authority
- Portfolio reporting without manual consolidation
- Integration failures and correction workflows
- Data export, retention and ownership
Before any demo, a PMIS Fit-Gap Analysis shows which control requirements a product meets as configured. For instance, use sample data from your organization during evaluation. After all, a scripted demonstration with perfect vendor data rarely exposes reconciliation, permissions or reporting problems.
However, if packaged products do not fit the operating model, custom software development services can be considered for specialized workflows, extensions and integrations. Custom development should solve a documented gap rather than reproduce standard functionality without a clear reason.
When Project Controls in PMIS Are Working Well
A mature control environment does not eliminate variance; instead, it makes variance visible early enough to manage.
As a result, you should see:
- One reconciled view of approved budget, commitments, actuals and forecast
- A logic-driven schedule with credible progress and finish dates
- Risks linked to affected work, quantified where material and assigned to owners
- Changes assessed across cost, schedule, scope and risk before approval
- Consistent KPI definitions across projects
- Forecast history that shows what changed, when and why
- Dashboards that lead to documented decisions and actions
- Less manual reconciliation at each reporting cycle
Ultimately, the strongest sign is improved forecast confidence. Leaders also understand the range of possible outcomes, the assumptions behind the forecast and the decisions required from them.
Conclusion
Project controls in a PMIS work best when scope, cost, schedule, risk and change data are connected to approved baselines and clear ownership. This gives teams one reliable view of performance and helps them detect variance early.
With trusted data and consistent processes in place, dashboards, earned value metrics and AI tools can support faster, better-informed project decisions.
Frequently Asked Questions
What Is The Role Of PMIS In Project Controls?
In short, a PMIS provides the governed data, workflows, integrations and reports needed to establish baselines, capture actual performance, measure variance, forecast outcomes and manage corrective action. It also connects cost, schedule, risk, scope and change information in one traceable environment.
What Are The Main Components Of Project Controls?
The core components are scope control, cost control, schedule control, risk management, change control, performance measurement, forecasting and reporting. Contract, resource, document and quality controls may also be included depending on the project and industry.
How Does A PMIS Support Cost Control?
In particular, a PMIS connects budgets, approved changes, commitments, actual costs, accruals, contingency and forecasts. It helps teams compare current performance with the baseline and understand expected final cost rather than relying only on invoices paid to date.
How Does A PMIS Support Schedule Control?
Specifically, it stores or receives baseline and current schedule data, tracks milestones and critical activities, records progress, identifies variance and connects schedule effects to cost, risk and change records. Detailed scheduling may remain in Primavera P6 or Microsoft Project while the PMIS consolidates governed results.
What Is EVM In A PMIS?
In short, Earned Value Management compares planned value, earned value and actual cost for the same work and reporting period. A PMIS can calculate cost and schedule variances, performance indices and completion forecasts when baseline, progress and actual-cost data are aligned.
Should Every Project Use Earned Value Management?
Not necessarily, since the right approach depends on the project. For example, formal EVM may be appropriate for large, complex or contractually governed projects. By contrast, smaller projects can use milestone, deliverable or quantity-based measures. Overall, the method should match the project’s risk, value and reporting obligations.
How Often Should Project Controls Data Be Updated?
In general, the frequency depends on the decision cycle and data source. For example, field progress may be captured daily, risks and changes reviewed weekly, and formal cost and schedule reporting completed monthly. However, critical issues should not wait for the next reporting period.
What Is The Difference Between A Baseline And A Forecast?
In short, the baseline is the approved reference used to measure performance. In contrast, the forecast is the current estimate of the final cost or completion date based on actual results, remaining work, active risks and known changes. Therefore, a forecast can change without altering the baseline.
Can A PMIS Replace ERP And Scheduling Software?
Sometimes, but replacement is not always the right goal. Instead, many organizations keep ERP as the financial system of record and a specialist application as the detailed scheduling system. The PMIS then integrates their data with risk, change, contracts, documents and portfolio reporting.