
Tableau BI Dashboard Implementation for QuantusTechnik
QuantusTechnik needed a faster way to monitor machine performance, operational activity, sales progress, and leadership KPIs in real time. SDLC Corp built Tableau dashboards that converted machine-level and operational data into clear business intelligence for faster reporting, better visibility, and data-backed decisions.
BI Platform: Tableau Industry: Machine Tools & Industrial Equipment Implementation Partner: SDLC Corp
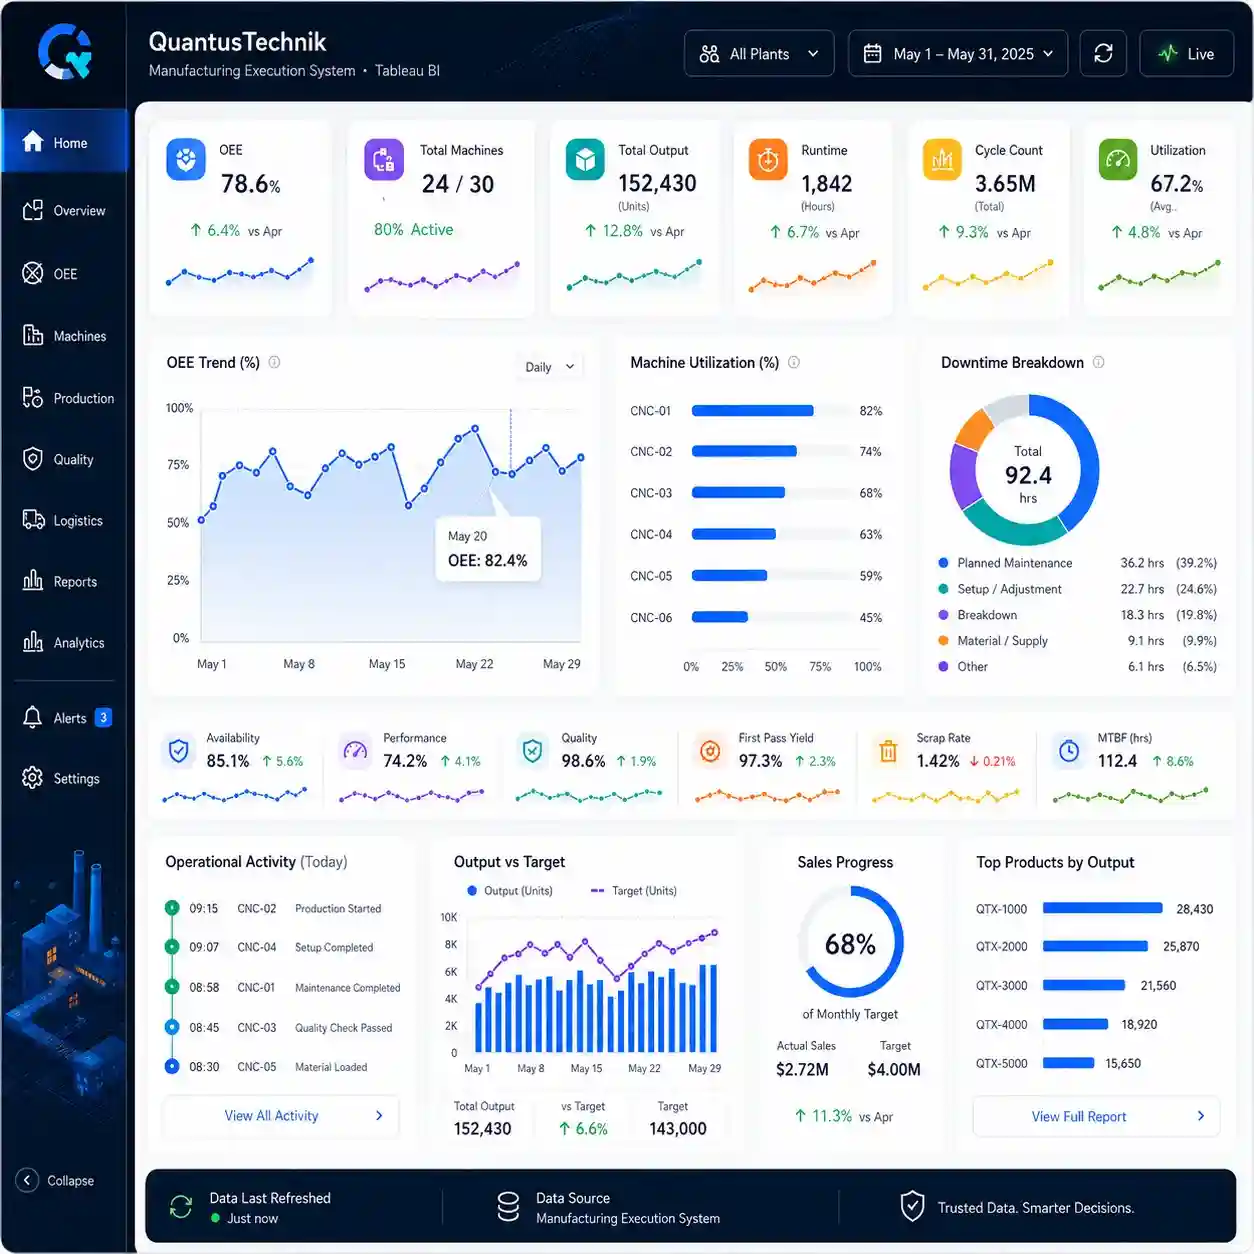
From Machine Data to Real-Time Tableau Intelligence
QuantusTechnik needed a real-time analytics layer to monitor machine performance, operational activity, sales progress, and leadership KPIs. SDLC Corp built Tableau dashboards that converted machine-level and business data into clear, decision-ready intelligence.
Client
QuantusTechnik
Industry
Machine Tools, Industrial Equipment & Precision Manufacturing
Solution Type
Tableau BI Dashboard Implementation
Implementation Partner
SDLC Corp
Core Focus
Real-time visualization of machine, operational, sales, and management KPIs across every business layer.
Data Focus
Machine output, efficiency, cycle count, runtime, utilization, machine age, sales, operations, and leadership KPIs.
Reporting Layer
Leadership dashboards, operational dashboards, and machine analytics dashboards - all unified in Tableau.
About QuantusTechnik and the Real-Time Reporting Challenge
QuantusTechnik supports manufacturing businesses with industrial technology and machine tools, where machine performance, operational visibility, sales tracking, and process efficiency are critical. As operations became data-driven, the company needed real-time visibility into machine performance, operations, sales progress, and leadership KPIs.
QuantusTechnik had valuable machine and business data, but manual reports, spreadsheets, follow-ups, and delayed reviews slowed visibility. SDLC Corp built a centralized Tableau analytics layer to turn scattered data into clear, real-time business intelligence.
When Machine Data Was Available but Decisions Still Waited
QuantusTechnik had access to important machine-level and business data, but teams could not review it quickly in one place. Reporting depended on manual data collection, spreadsheet preparation, internal follow-ups, and delayed reviews - which slowed decision-making across operations, sales, machine utilization, and leadership reporting.
CHALLENGE 01
No Machine Performance Dashboard in Place
Output, cycle count, runtime, efficiency, and utilization had no central machine performance dashboard - forcing teams to run manual lookups every reporting cycle just to check basic KPIs.
CHALLENGE 02
Manual Spreadsheets Caused Reporting Delays
Every report required manual spreadsheet preparation, repeated data entry, and team follow-ups - adding hours to each cycle before leadership could see any operational numbers.
CHALLENGE 03
Siloed Data with No Tableau BI Dashboard
Machine performance, sales activity, purchase status, and inventory data were siloed across separate workflows. Without a Tableau BI dashboard, no consolidated view existed to support faster decisions.
CHALLENGE 04
Lack of Real-Time KPI Visibility Slowed Decisions
Without real-time KPI visibility, leadership relied on outdated manual updates - making it harder to catch performance gaps, underutilized equipment, and operational exceptions fast enough to act.
Turning Machine Data Into Real-Time Business Intelligence
SDLC Corp built a centralized Tableau BI dashboard solution to give QuantusTechnik real-time visibility into machine performance, operational activity, sales progress, and leadership KPIs - replacing manual reporting with interactive dashboards every team could act on immediately.
Eliminate Manual Lookups with Live Machine KPI Visibility
Built to show machine output, cycle count, runtime, efficiency, and utilization in one interactive view - giving every team instant access to machine performance data with no manual lookups required.
Cut Reporting Delays with a Single KPI Dashboard
Consolidated sales activity, purchase status, and inventory movement into one centralized Tableau reporting system - cutting the manual follow-ups that had been slowing every reporting cycle.
Faster Decisions Through Real-Time KPI Visibility
Real-time KPI visibility gave leadership a live view of performance gaps, trends, and exceptions - so decisions could be made on current data, not delayed manual reports.
From Raw Machine Data to Live Tableau BI Dashboards
SDLC Corp followed a structured Tableau BI dashboard implementation process to convert QuantusTechnik’s machine-level, operational, and sales data into real-time Tableau dashboards. The goal was to define the right KPIs, clean and organize scattered data, and build machine performance dashboards that leadership and business teams could use daily for faster decisions.
Discover KPIs
Identify machine, operational, sales & leadership metrics
Structure Data
Map sources, clean data & define calculation logic
Build Dashboards
Design live Tableau views with filters, drill-downs & trends
Phase 1 — Audit & Planning
Foundation, data mapping & KPI definition
KPI Discovery & Dashboard Planning
Identified key metrics for machine performance, operations, sales, and leadership reporting.
Data Source Identification
Mapped required machine-level and business data sources for Tableau development.
Data Cleaning & Structuring
Organized raw data into a clean structure so dashboards could surface accurate insights.
Metric Definition & Logic
Defined how output, efficiency, cycle count, runtime, utilization & machine age are calculated.
Phase 2 — Dashboard Build
Tableau design, visualization & interactivity
Tableau Dashboard Design
Created layouts that made complex machine and operational data easy to understand.
Machine KPI Visualization
Visualized output, efficiency, cycle count, runtime, utilization & usage patterns live.
Operations KPI Visualization
Added sales activity, purchase status, inventory, service coordination & workload views.
Filters, Drill-Downs & Trends
Set up filters and drill-downs so users can explore by machine, time period & area.
Phase 3 — Testing & Launch
Validation, refinement & user training
User Testing & Dashboard Refinement
Tested dashboards with business users, checked usability, and refined views to support practical day-to-day decision-making.
Deployment & Training
Deployed the Tableau BI dashboards and trained users to monitor KPIs, review trends, reduce manual reporting, and act faster on insights.
Tableau BI Dashboards Built to Track Every Critical Business Signal
SDLC Corp designed 7 Tableau BI dashboards across machine performance, operational activity, sales visibility, and leadership reporting - turning complex data into clear, real-time insights for every team.
Machine Output Dashboard
Tracked total output, machine-wise production, time-based trends, and performance comparison across all machines in real time.
Machine Efficiency Dashboard
Showed efficiency percentage, expected vs. actual performance, low-efficiency machines, and productivity gaps for quick corrective action.
Cycle Count Dashboard
Visualized completed cycles, daily and monthly activity, workload patterns, and machine usage intensity across the production floor.
Machine Age & Usage Dashboard
Connected machine age with runtime, cycle count, usage history, workload trends, and maintenance planning indicators for proactive operations management.
Runtime & Utilization Dashboard
Displayed active runtime, idle time, utilization percentage, underused machines, and capacity usage trends to optimize floor-level performance.
Operations Performance Dashboard
Covered sales activity, purchase status, inventory movement, service coordination, approvals, and task progress in one consolidated operational view.
Leadership KPI Dashboard
Gave management one unified view of business performance, machine efficiency, sales visibility, operations, trends, and exceptions - enabling faster, data-backed executive decisions across every business layer.
Together, these 7 Tableau dashboards helped QuantusTechnik move from delayed manual reporting to real-time operational intelligence - giving every team, from machine operators to the C-suite, full visibility to act decisively.
Tableau BI Business Impact After Go-Live
The Tableau BI dashboards helped QuantusTechnik move from delayed spreadsheet reporting to real-time KPI dashboard visibility. Teams could review machine performance analytics, track operational trends, automate reporting workflows, and make faster decisions with clearer business data.
Six Areas Where QuantusTechnik Saw the Difference
From faster reviews to stronger machine performance analytics, every team gained clearer visibility after Tableau BI went live.
Faster Reporting Reviews
Leadership accessed key metrics instantly instead of waiting for manually prepared reports - reducing review cycles from days to minutes.
Reporting Speed ↑Lower Manual Workload
Automated Tableau dashboards reduced spreadsheet preparation, data formatting, and repeated internal follow-ups across operational teams.
Manual Effort ↓Better Machine Visibility
Teams monitored output, efficiency, cycle count, runtime, utilization, and machine age in one place with live updates throughout the day.
Live KPI ViewStronger Decision-Making
Centralized KPI dashboards helped leaders identify gaps, trends, and exceptions faster - moving from reactive to proactive management.
Data-Backed DecisionsImproved Accountability
Teams gained clearer visibility into bottlenecks, pending activities, and operational performance trends - improving ownership at every level.
Team Ownership ↑Future-Ready BI Layer
The Tableau setup created a scalable analytics base for advanced reporting, AI insights, and predictive analytics as operations grow.
Scalable FoundationBefore and After Tableau BI Dashboard Implementation
Every row shows the exact state before SDLC Corp built the Tableau layer - and what QuantusTechnik gained after going live. The difference is measurable, visible, and real.
Why QuantusTechnik Chose SDLC Corp for Tableau BI Dashboard Implementation
SDLC Corp brought the right combination of industrial domain knowledge and Tableau expertise to deliver dashboards that teams actually use every day.
QuantusTechnik needed a partner who could understand industrial operations, machine data, ERP-linked reporting, and business KPIs - not just build dashboards in isolation.
SDLC Corp brought expertise across Tableau BI dashboard implementation, data structuring, KPI planning, manufacturing BI, and machine analytics dashboard development to turn scattered operational data into a clear reporting system.
The result was a real-time KPI dashboard ecosystem that improved machine visibility, reduced delayed reporting, and helped teams make faster, data-backed decisions from the shop floor to leadership.
SDLC Corp Expertise
8 AreasA Partner Who Understands Your Industry, Not Just Your Software
Every Tableau engagement starts with your business context - from KPI discovery to full deployment, built for how your team actually works.
Technology Used for the Tableau BI Dashboard Implementation
BI Platform
Tableau
Dashboard Type
Real-time operational and machine performance dashboards
Data Focus
Machine output, efficiency, cycle count, runtime, utilization, machine age, sales, operations, management KPIs
Reporting Layer
Leadership dashboards, operational dashboards, and machine analytics dashboards
Implementation Partner
SDLC Corp
Industry
Machine Tools & Industrial Equipment, Precision Manufacturing Technology
Live Operational Intelligence for Manufacturing Decision-Making
SDLC Corp helped QuantusTechnik build real-time Tableau dashboards that transformed machine and operational data into clear, actionable business intelligence - accessible to every level of the organization.
The dashboards visualized machine output, efficiency, cycle count, runtime, machine age, utilization, sales activity, operational progress, and leadership KPIs in one unified analytics layer.
With Tableau, QuantusTechnik reduced manual reporting effort, improved reporting speed by up to 70%, gained real-time visibility, and created a stronger foundation for data-driven decision-making.
Build Real-Time Tableau BI Dashboards for Your Business
SDLC Corp helps manufacturing, industrial, trading, and service companies build Tableau dashboards for machine analytics, operational reporting, sales visibility, and leadership decision-making.
Machine-Level Analytics
Output, efficiency, cycle count, runtime, utilization, and machine age - all in one Tableau layer.
Operational & Sales Visibility
Sales activity, purchase status, inventory movement, and service coordination tracked live.
Leadership Decision-Making
One unified KPI dashboard for management - exceptions, trends, and business performance at a glance.
- Contact Us
Let’s Talk About Your Product
What happens next?
- We review your requirements
- Strategy call with experts
- Clear roadmap & estimate
- NDA Protected
- Enterprise Grade Delivery
- Global Clients
- By submitting this form, you acknowledge that SDLC Corp may process your details to respond to your inquiry. See our Privacy Policy and Cookie Notice.


