
Proposed Solution Scenario

Governed Analytics for Higher Education

This higher education analytics platform connects student and finance data. Shared definitions and access controls support trusted enrollment, funding, and student outcome reporting.

  • Connected views of enrollment, finance, and student progress.
  • Clear reporting dates, metric definitions, and owners.
  • University teams control planning and support decisions.
Discuss Your Project
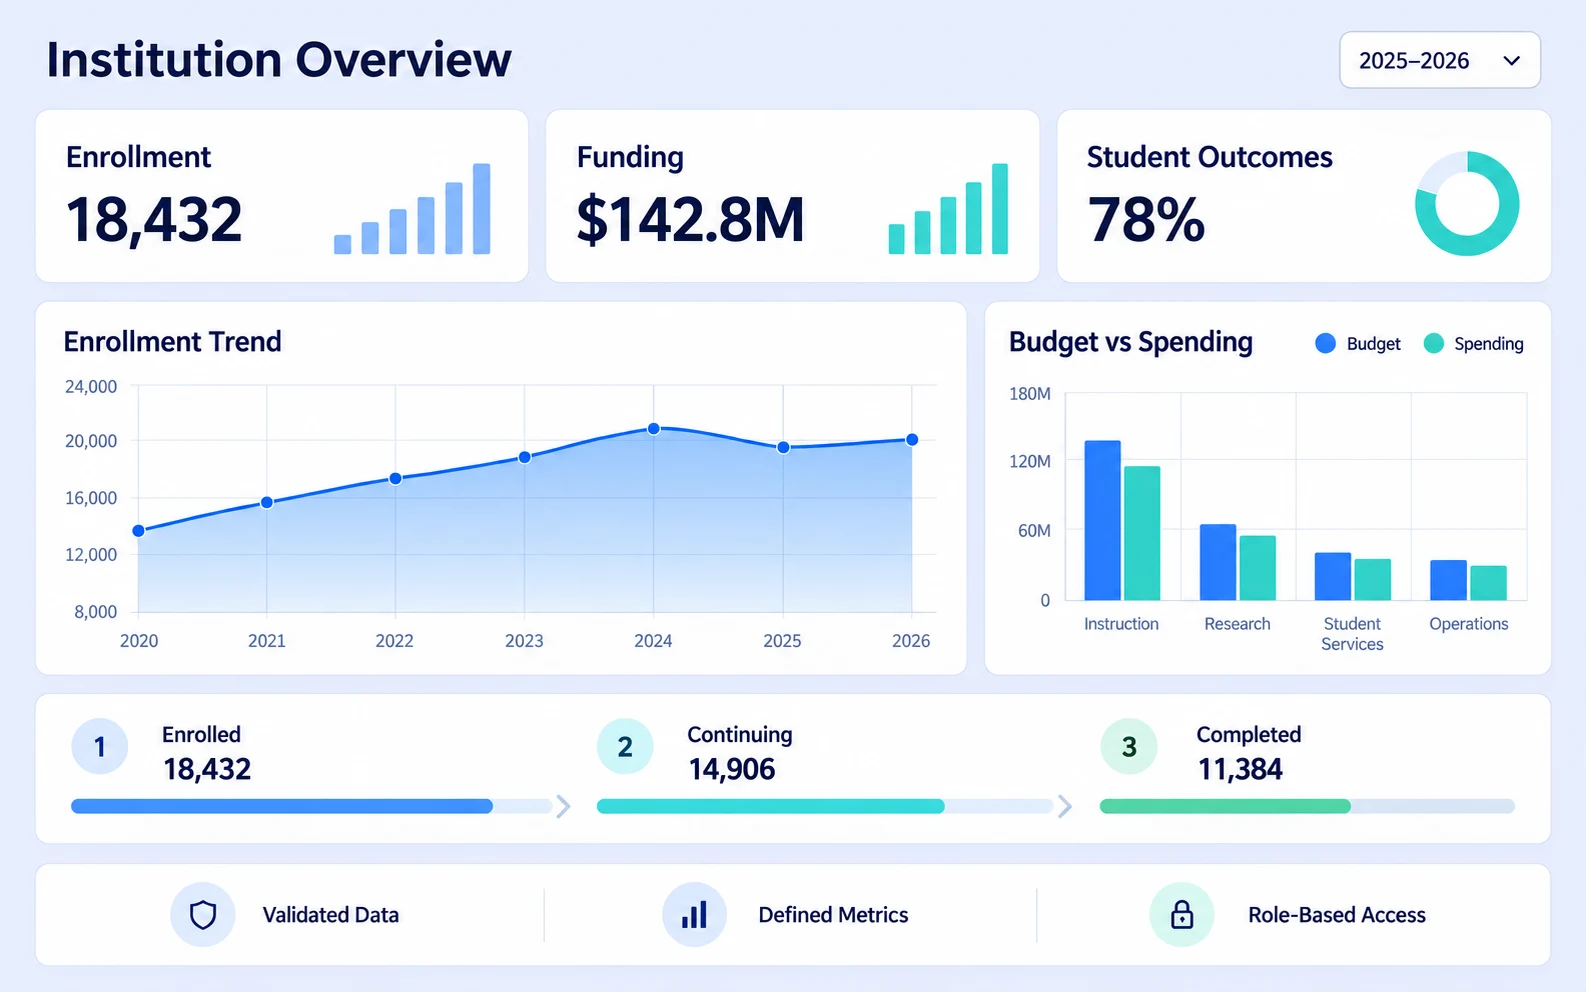
Higher education analytics dashboard showing enrollment, funding, and student outcomes
Project Snapshot

Project at a Glance

The project connects campus data through a governed higher education analytics platform. Existing systems still manage admissions, student records, and finance.

Primary Users

Admissions, finance, institutional research, academic leaders, and authorised support teams

Core Analytics

Enrollment, funding, resource planning, and student outcomes

Integration Focus

Admissions CRM, student information system, and finance ERP

Governance Controls

Definitions, ownership, quality checks, access, and traceability

Industry

Higher Education

Project Type: Data Integration and Governed Analytics

Shashank Jaiswal, Co-founder and CIO of SDLC Corp
Co-founder & CIO

Shashank Jaiswal

Leads enterprise technology delivery at SDLC Corp across Odoo ERP, CRM, Salesforce, process automation, integration, and digital transformation.

The Challenge

Disconnected Data Slowed Decisions

Campus records follow different processes and reporting schedules, so teams must combine exports and resolve differences before preparing shared reports.

The scenario addresses eight challenges:

  • Separate admissions, student, and finance records.
  • Different definitions of enrolled students.
  • Duplicate or unmatched student records.
  • Inconsistent reporting dates.
  • Repeated spreadsheet preparation.
  • Outdated enrollment assumptions in financial forecasts.
  • Limited retention and completion reporting.
  • Unclear ownership of data errors.

The institution needs connected information because teams rely on clear definitions, dates, and access rules.

Our Solution

Connected Analytics With Clear Controls

The proposed platform connects approved campus data through shared reporting models, and governance rules define each measure and control access.

Enrollment Analytics

Admissions teams track applications, enrollment targets, and programme trends, so comparisons use consistent stages and reporting dates.

Funding and Resource Planning

Finance teams review tuition revenue, budgets, and spending alongside enrollment figures, but forecasts remain separate from recorded financial results.

Student Outcome Analytics

Academic teams track retention, progression, and completion for defined student groups and periods, then coordinate support after reviewing patterns.

Higher Education Data Governance

Named owners approve metric definitions and quality checks, while role-based access, regular reviews, and source traceability support controlled reporting. Access rules also help institutions meet FERPA duties for student records.

Workflow

How the Reporting Process Works

A repeatable reporting process turns source records into trusted reports, using custom API development and integration to connect each system. Teams first agree on the questions and measures.

  1. Define

    Agree on calculations, student groups, reporting dates, and owners.

  2. Collect

    Load approved admissions, student, and finance records.

  3. Match

    Link identifiers and map programme codes and reporting periods.

  4. Validate

    Check duplicates, missing fields, codes, and source totals.

  5. Review

    Send unexplained differences to responsible teams.

  6. Publish

    Release business intelligence dashboards with refresh dates and metric definitions.

  7. Monitor

    Track failures, resolve errors, and review changes.

One Reporting Context

Student and financial records retain their original detail, but shared mappings support comparisons without duplicating student counts or financial amounts.

Departmental Review

Representatives check dashboard figures against approved source reports, and training explains filters, definitions, and reporting limits. Public institutions should also test dashboards against WCAG 2.1 and the ADA Title II accessibility requirements.

Technology

Technology Stack and Architecture

The proposed stack supports integration, reporting, and controlled access, so these tools together connect enrollment, funding, and student outcome analytics.

  • Python
  • SQL
  • REST APIs
  • Azure Data Factory
  • Azure Data Lake Storage
  • Azure Functions
  • Azure SQL Database
  • dbt
  • Microsoft Power BI
  • Microsoft Entra ID
  • Microsoft Purview
  • Azure Key Vault
  • Azure Monitor
  • Git
  • Azure DevOps
  • pytest
Comparison

Before and After Implementation

The design connects reporting tasks with clear controls, and the table below shows the intended changes.

Before Intended After
Separate departmental exports Connected reporting datasets
Different enrollment definitions Approved stages and counting rules
Repeated student matching Defined matching and error review
Manual reconciliation Scheduled checks with named owners
Disconnected financial assumptions Enrollment-informed planning
Inconsistent outcome comparisons Defined student groups and periods
Manually shared reports Role-based dashboard access
Difficult source checks Traceable calculations and reporting records
Results

Expected Reporting Improvements

The proposed design targets five improvements, but the institution must measure them before reporting achieved results.

01 / 05

One Governed Reporting View

Teams review related information through approved measures, so they can interpret reports using the same definitions.

More Consistent Enrollment Figures

Clear stages and dates support comparable counts, and checks flag unexplained differences before publication.

Clearer Financial Planning

Finance teams review enrollment assumptions alongside budgets, so they can assess revenue scenarios using documented inputs.

Better Student Progress Visibility

Consistent student groups support retention and completion comparisons, but staff review the findings before choosing support actions.

Less Repeated Reporting Work

Scheduled pipelines aim to reduce spreadsheet preparation, so reporting hours and manual effort should form part of the evaluation.

The Outcome

One Connected Reporting Foundation

Governed analytics for higher education links campus information with clear reporting rules, so these controls support planning and student support decisions.
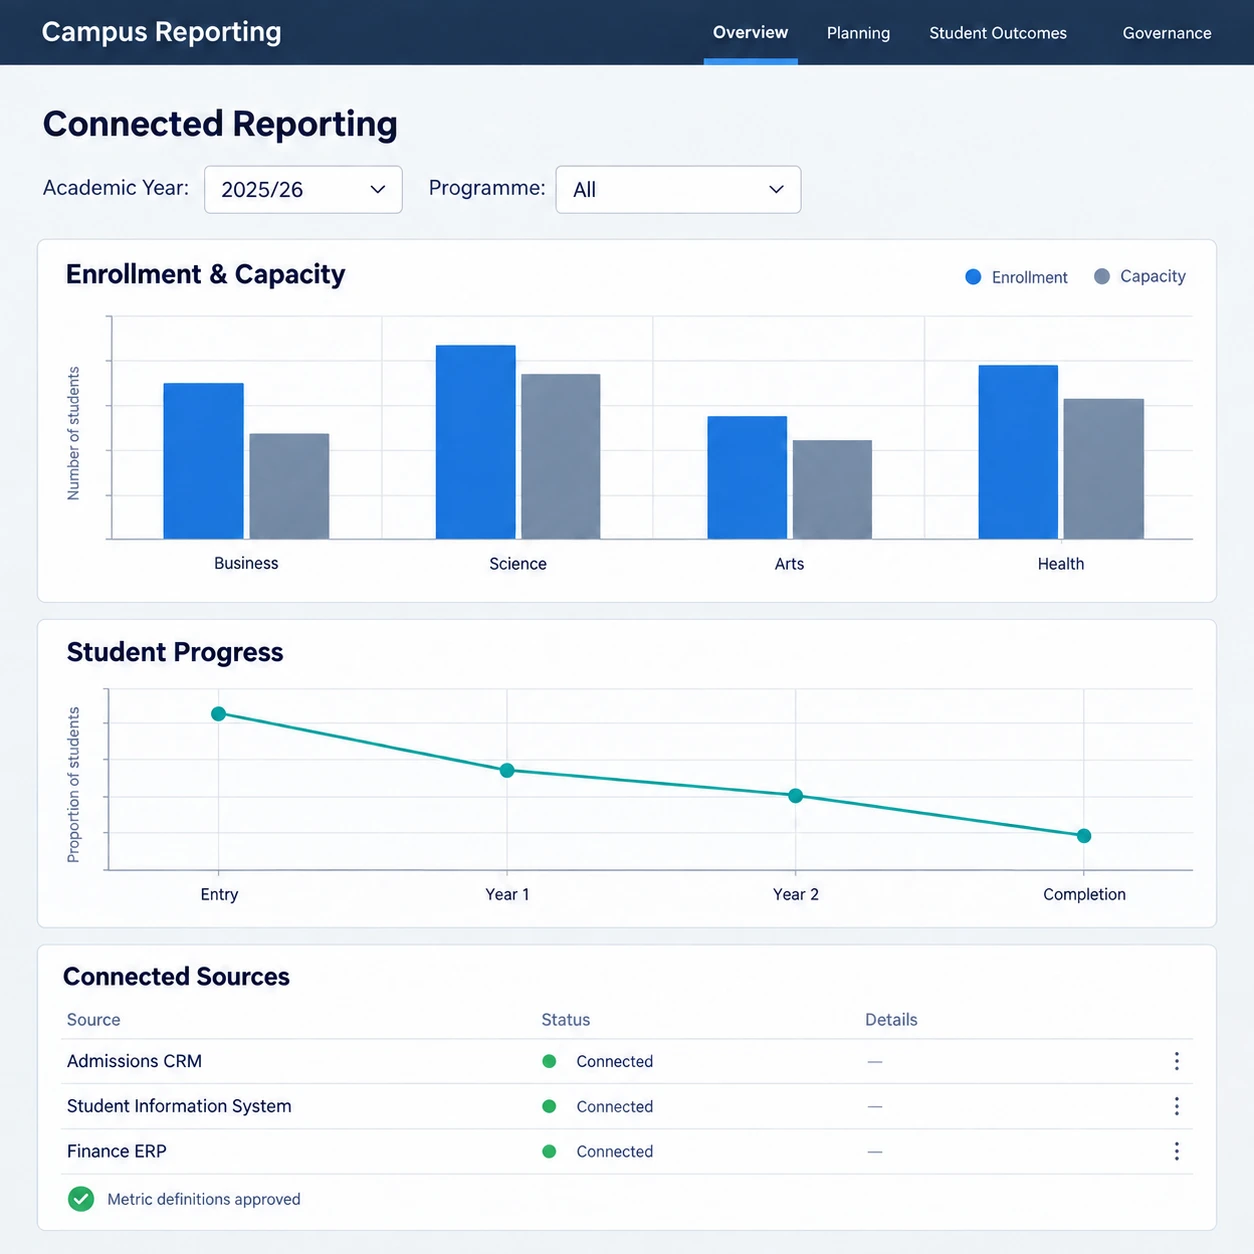
Higher education analytics reporting overview

Connected Planning

Enrollment and funding analytics brings related questions into one reporting context, so enrollment below plan can prompt revenue and course-capacity reviews.

Informed Student Support

Retention and completion reports highlight patterns for investigation, while staff consider student circumstances before taking action.

Room for Additional Reporting

Approved models can support further reporting needs, but each addition requires suitable sources, definitions, and permissions. For related work, see our Education Event Platform case study.

Get Started

Build Trusted Higher Education Analytics

Connect campus reporting around reliable data and clear definitions. Discuss your enrollment, funding, and student outcome requirements with SDLC Corp.

Talk to Our Team
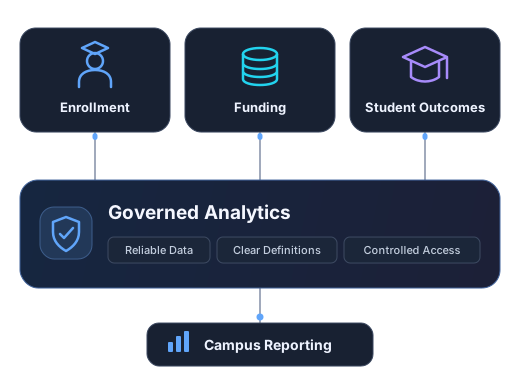
Enrollment, funding, and student outcomes connected through governed analytics to campus reporting
FAQ

Frequently Asked Questions

Explore how connected campus data, shared definitions, and controlled access support higher education reporting.

What Is Governed Analytics for Higher Education?

It combines campus data with approved definitions, ownership, quality checks, and access rules, so teams can understand their reports.

Which Systems Can the Platform Connect?

Sources include admissions CRMs, student information systems, and finance ERPs, but connections depend on supported interfaces and permissions.

How Does the Platform Keep Enrollment Figures Consistent?

Each measure defines who counts, at which stage, and on which date, and checks identify duplicates and unexplained differences.

What Funding Information Does the Solution Cover?

The scope covers budgets, spending, tuition revenue, and resource planning, while financial aid and research grants require additional scope.

How Does the Platform Measure Student Outcomes?

It follows defined student groups across agreed periods, so reports explain their retention, progression, and completion rules.

Who Can Access Student-Level Information?

Authorised staff receive access based on their responsibilities, while summary dashboards limit unnecessary exposure of individual records. Access controls also support FERPA requirements for student records.

Can the Platform Support Enrollment Forecasting?

Yes, where suitable historical data and validation exist, but forecasts remain estimates with stated assumptions and uncertainty.

How Should the Institution Measure Success?

Track reporting time, manual effort, errors, refresh reliability, and adoption, then assess wider outcomes using defined periods and evidence.

Let’s Talk About Your Your Product

Get expert guidance on scope, architecture, timelines, and delivery approach so you can move forward with confidence.

What happens next?