
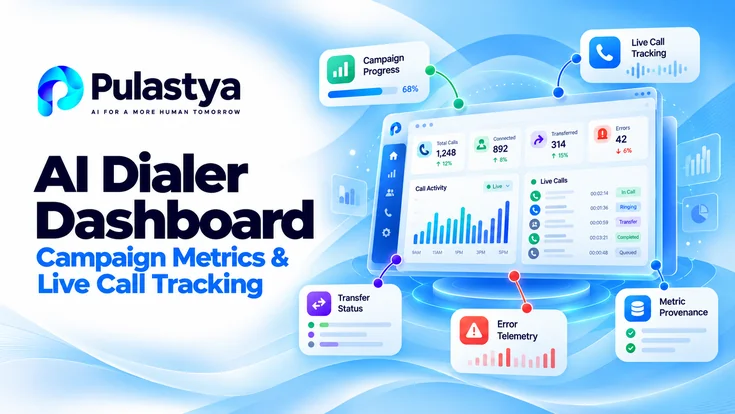
An AI dialer dashboard must present campaign metrics and live call tracking as operational signals that sales ops, contact center managers, and engineers can act on.
Present real-time call state, throughput, transfer outcomes, and metric provenance so teams reduce time-to-detect and time-to-resolve campaign exceptions while preserving auditability and data lineage.
- Real-time signals matter Live call state, queue depth, and transfer outcomes give operational teams the ability to detect and act on campaign exceptions within minutes.
- Group for action Group campaign progress, live activity, and transfer status into related views so users can move from trend to individual call context with a single click.
- Provenance and verification Separate derived or advisory metrics from fields measured by product telemetry and show data lineage so downstream reporting and compliance teams can trust dashboard numbers.
Operational dashboards for outbound AI must balance high-level campaign health with immediate call-level context. Stakeholders need throughput trends, live call states, agent or system transfer paths, and clear flags for soft and hard failures to prioritize investigation and mitigation within minutes, not hours.
Design metrics so they are actionable: pair rates with denominators and tolerances, expose latency and error breakdowns, and tag values with source and verification status. Clearly mark any metric that is not yet instrumented so no one mistakes it for a measured value.
What an Outbound Campaign Dashboard Should Show
Start with three user goals: surface campaign-level health, enable fast drill-down to live calls, and make metric provenance explicit. Campaign health answers whether targets are on track. Drill-down answers why the campaign is off track. Provenance answers whether the numbers are trustworthy for downstream decisions.
Prioritize metrics that combine rate and denominator: dial attempts per minute with answered rate, connections per hour with hold-time distribution, and transfer rate with transfer success ratio. Each metric should display its time window and sampling cadence so stakeholders can compare apples to apples.
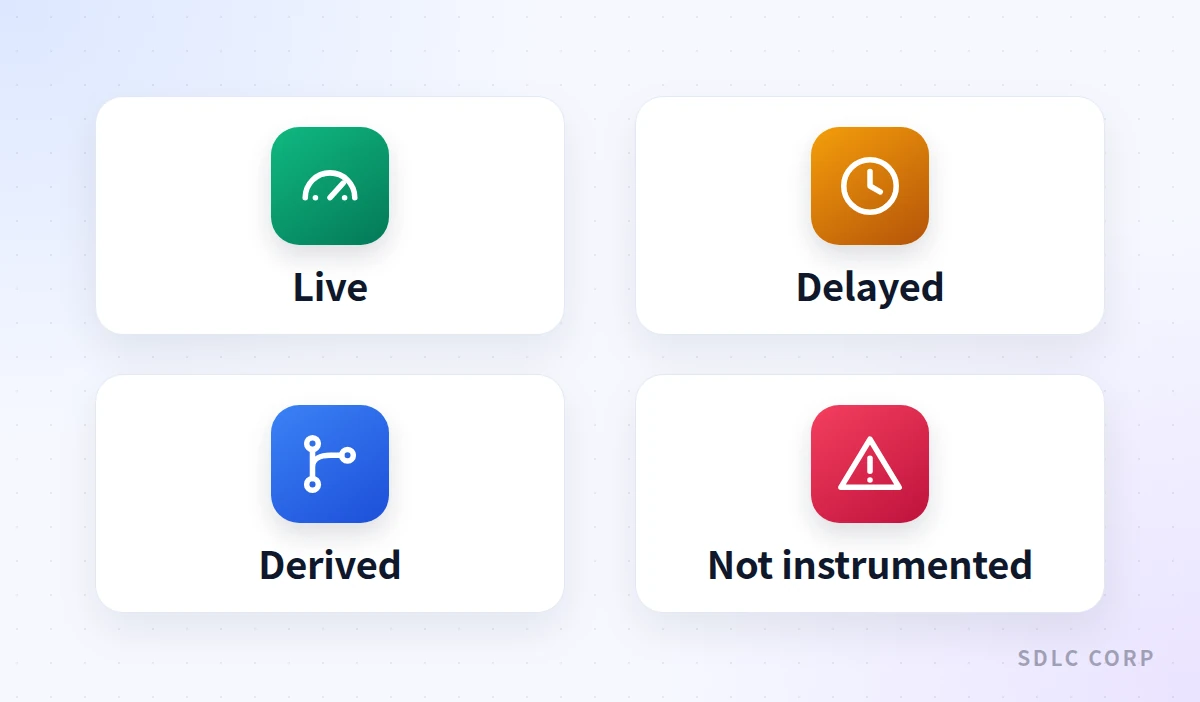
Include operational telemetry alongside business metrics: system-side latency, call setup failures, simultaneous call limits reached, and third-party carrier errors. Present these signals with short tooltips that define whether a value is live, delayed, or aggregated for reporting.
Metric priority list (structured): 1) Live throughput: active calls and attempts/minute with timestamps. 2) Answered quality: answered rate plus hangup within 15s. 3) Transfer health: attempted transfers, accepted transfers, and failed transfer reasons. 4) Error telemetry: setup failures, carrier errors, and consent issues.
- Active calls and attempts-per-minute with sliding-window timestamps for immediate capacity decisions.
- Answer rate and short-call ratio to detect poor matches or script issues.
- Transfer attempts and acceptance rate broken down by destination type.
- Call setup failures with carrier and SIP response codes for rapid diagnosis.
- Latency percentiles for key steps: dialing, voice prompt, and transfer completion.
Prioritize metrics that are interpretable without additional queries and always show timestamps and data freshness.
Grouping Campaign Progress, Live Activity and Transfer Status
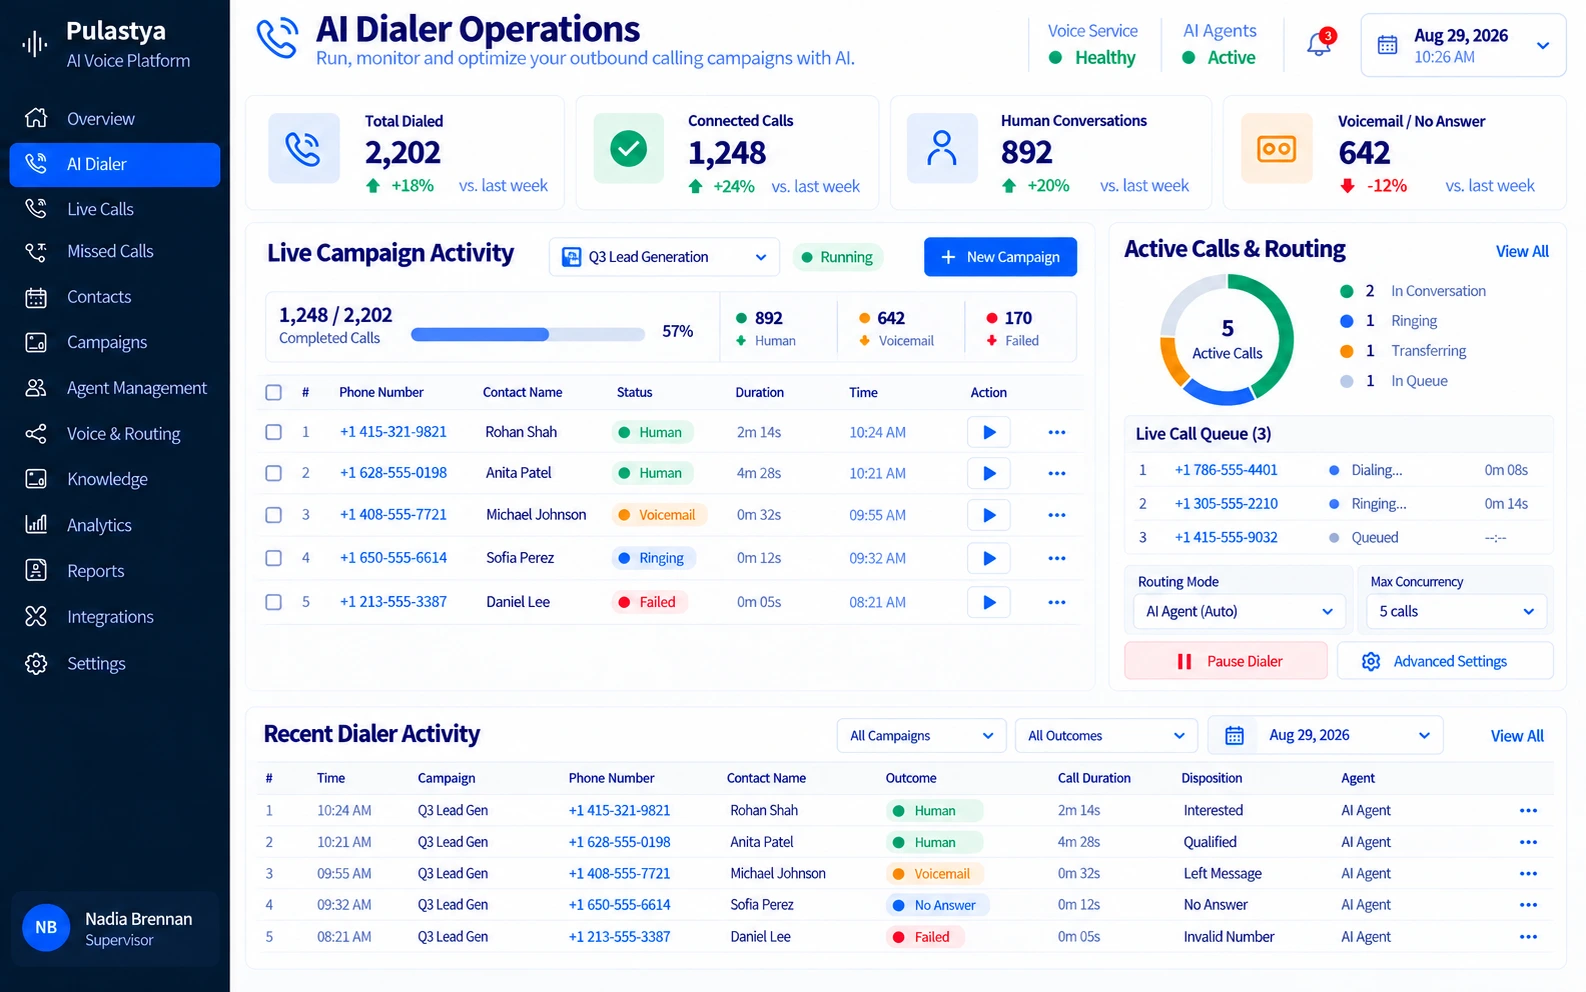
Group related signals into three linked panels: campaign progress (aggregate and trend), live activity (call-level real-time states), and transfer status (queue, destination, and outcomes). Make transitions between panels one-click to preserve context and prevent wasted time hunting for the failing call.
Use consistent identifiers across views so a campaign ID, contact ID, and call session ID persist when users switch from a trend to the live call record. Display the most recent actor for a call: AI agent, human agent, IVR, or external transfer endpoint.
Design the live activity panel for triage: sortable columns for call age, current state, wait time, last event, and an actions column that supports inspect, mute, or escalate functions. When transfers are in progress show destination, estimated wait, and transfer attempt count.
Practical scenario: transfer storm. Sequence: 1) Dashboard shows sudden transfer rate spike with rising failures. 2) Drill to live activity and filter for calls that attempted transfer in the last five minutes. 3) Identify common destination and carrier codes. 4) Isolate faulty routing, pause transfers, and update routing rules.
- Campaign progress: completion percent, remaining contacts, success forecast with confidence bounds.
- Live activity: call session IDs, origin campaign, current state, and elapsed time.
- Transfer status: destination endpoint, queue length, attempts, and failure reason categories.
- Context switches must preserve filter and sort state to avoid losing investigative context.
Group signals so a single click moves an operator from trend detection to the exact live call causing the anomaly.
From trend to call
What Each Dashboard Panel Shows and the Action It Supports
| Panel | Key metrics | Action it supports |
|---|---|---|
| Campaign progress | Completion percent, remaining contacts, answer rate and short-call ratio | Spot an off-track campaign and drill into the calls behind the trend |
| Live activity | Call session ID, current state, elapsed time, last event and current actor | Inspect, mute or escalate the specific call causing the anomaly |
| Transfer status | Transfer attempts, acceptance rate, destination, queue length, failure reasons | Isolate a faulty destination, pause transfers and update routing rules |
| Error telemetry | Call setup failures, carrier errors, SIP response codes, latency percentiles | Escalate to engineering and apply temporary campaign rate limits |
| Metric provenance | Source, data freshness, live or derived label, verification status | Confirm a number is trustworthy before it drives a decision or report |
Panels share campaign, contact and call IDs, so an operator can move from a trend in one panel to the exact call and action in the next.
Using Dashboard Signals to Investigate Exceptions
Dashboards should surface exceptions with clear precedence rules: systemic errors (carrier outages) first, then campaign-level anomalies (abnormal short-call rates), and finally individual call failures. Flag exceptions with severity tags and recommend initial triage steps to reduce cognitive load for operators.
Implement an evidence trail for each exception: chart the first detected metric deviation, list correlated signals, and link to the earliest related call session. The trail accelerates root-cause analysis and supports post-incident reviews and SLA reporting.
Quick triage usually ends in one of three outcomes, each with its own remediation: 1) False positive caused by sample noise-monitor and adjust thresholds. 2) System or carrier issue-escalate to engineering and apply temporary campaign rate limits. 3) Data or configuration error-rollback or update campaign parameters and reprocess samples.
- Exception flags tied to thresholds and adaptive baselines rather than single-point anomalies.
- Correlated signal list showing which other metrics moved at the same time and by how much.
- Link to raw call logs and transcript snippets with timestamps for confirmation.
- Suggested first actions displayed with each exception: pause campaign, filter affected calls, notify engineering.
Provide an evidence trail that links metric deviation to specific calls and suggested containment actions.
Separating Derived Dashboard Metrics From Measured Fields
Document which dashboard fields are derived calculations and which come directly from measured call telemetry. Label calculated metrics as derived or advisory and show the formula, data sources, and update cadence. This prevents misinterpretation during audits or executive reviews.
Create a provenance panel for each metric that lists source tables, transformation steps, and any sampling or downsampling applied. Record whether each metric is synthetic or measured by product instrumentation, and flag metrics that depend on instrumentation not yet in place.
Governance checklist for metric validation: maintain schema versioning, require a verification test for each product field, and publish a changelog when metric definitions change. Tie checklist artifacts to the dashboard tooltip for quick access.
Operational process: 1) Owners declare metric definition and source. 2) Metric undergoes verification tests and a sign-off. 3) Dashboard displays verification status and date. 4) Any change triggers stakeholder notification and re-run of key historical aggregates.
- Label metrics explicitly: live, delayed, derived, or not yet instrumented.
- Provide transformation formulas and sample queries for derived metrics so analysts can reproduce values.
- Maintain a verification status indicator and last-verification timestamp for product fields.
- For metrics still awaiting instrumentation, mark them clearly and show the expected data model and dependencies.
Make metric provenance visible and actionable so users can trust numbers for operational decisions and audits.
What a dashboard can show depends on how campaigns, leads and agents are configured; see AI calling campaign setup for those upstream rules.
Signals that need action after a run rather than during it belong in the campaign reporting workflow of completion reports and exception alerts.
Conclusion
An effective AI dialer dashboard brings campaign performance, live call tracking, transfer monitoring, and error detection into a clear operational view. By organizing related metrics and enabling teams to investigate individual calls, it becomes easier to identify campaign issues, understand their causes, and take informed corrective action.
Reliable monitoring also depends on accurate metric definitions, transparent data sources, and clearly displayed update times. Organizations evaluating or designing an AI dialer dashboard should prioritize actionable metrics, accessible call-level information, and measurable operational outcomes rather than adding unnecessary dashboard complexity.
Frequently Asked Questions
Top-level metrics should include live active calls, attempts per minute, answered rate with short-call ratio, transfer attempts and acceptance rate, call setup failures with error categories, and data freshness timestamps. Each metric must show its time window and whether it is live, aggregated, or sampled.
Show transfer failures with destination type and failure reason aggregated by carrier or endpoint. Provide a one-click filter to list recent calls with transfer attempts, then inspect session logs and SIP response codes. Recommended first steps: pause transfers, isolate affected destinations, and escalate to engineering with correlated telemetry.
Expect practical live-tracking latency to vary by architecture; design targets often range from near real-time to a few seconds. State data freshness explicitly on the dashboard. If lower latency is a target you have not reached yet, show the current observed latency alongside the target for transparency.
Label derived metrics as such and publish their formulas and data sources. Keep a verification status for every product field and require sign-off before a derived metric is promoted to an authoritative field used in reporting or SLAs. Maintain a changelog for metric-definition updates.
Triage sequence: 1) Confirm the metric deviation and data freshness. 2) Check correlated system telemetry for carrier or infrastructure errors. 3) Drill to live calls to locate common patterns (destination, script, or contact list). 4) Contain with rate limits or pause, then escalate to engineering if systemic.