
Machine Monitoring IoT Case Study

Industrial IoT Machine Monitoring System for QuantusTechnik

SDLC Corp built a connected Industrial IoT monitoring system for QuantusTechnik to track machine output, runtime, cycle count, idle time, utilization, and efficiency in real time.

  • Real-time visibility into machine output, runtime, idle time, and cycle activity.
  • Automated tracking for efficiency, utilization, and shop-floor performance data.
  • Clean reporting structure for faster monitoring, review, and operational decisions.
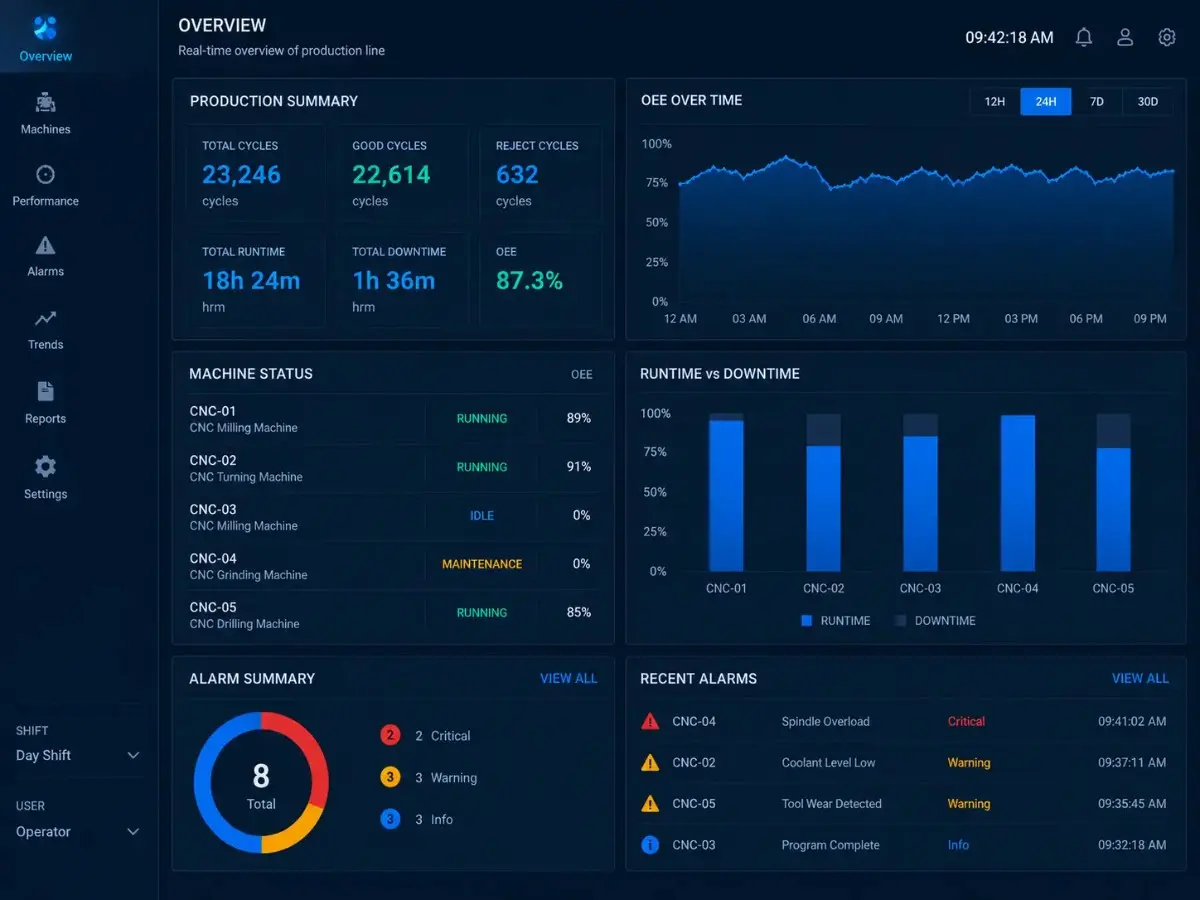
Industrial IoT machine monitoring system dashboard at QuantusTechnik manufacturing facility
Project Snapshot

Industrial IoT Project Snapshot

Here is a quick view of the machine monitoring system SDLC Corp built for QuantusTechnik. It covers the client context, tracked metrics, and business impact.

Client
QuantusTechnik
Industry
Machine Tools & Precision Manufacturing
Solution Type
Industrial IoT Machine Monitoring System
Partner
SDLC Corp
Project Objective
Core Need
Replace manual machine tracking with automated real-time monitoring.
Main Problem
The team had delayed production visibility, high manual reporting effort, and inconsistent machine data.
System Outcome
The solution converted connected machine data into clear monitoring and reporting views.

Metrics Tracked

The system captured machine activity in real time. As a result, managers reviewed production status faster.

Output Cycle Count Runtime Idle Time Utilization Efficiency Machine Age
60% less

Automated IoT data capture replaced operator-led logs and reduced manual machine reporting.

70% faster

Real-time machine visibility and structured reports helped teams monitor operations faster.

```html
Client Overview

Understanding the Client Behind the Monitoring System

Rajesh Gaikwad needed a clearer way to track machine activity, reduce manual reporting, and improve production visibility from a single connected system.

Client Requirement

The client wanted to move away from delayed manual updates and gain live visibility into machine output, runtime, cycle count, utilization, and operational efficiency.

01

Primary Need

Real-time machine monitoring with accurate production and activity data.
02

Main Challenge

Manual tracking delayed decisions and made machine performance harder to measure.
03

Project Focus

Connect machine data, process activity signals, and show usable monitoring insights.
04

Expected Outcome

Faster monitoring, less reporting effort, and better production visibility.
RG
Client Name

Rajesh Gaikwad

Rajesh Gaikwad of QuantusTechnik worked with SDLC Corp to build a practical IoT monitoring layer that turns machine activity into clear operational data.

Machine Monitoring Industrial IoT Production Visibility Reporting Automation
Client Goal Replace manual production tracking with a connected monitoring system that supports faster decisions and scalable manufacturing visibility.
```
The Challenge

Manual Tracking Delayed Production Visibility

QuantusTechnik used operator logs to track machine performance. However, reports arrived late. This made utilization gaps, idle time, and productivity issues harder to fix quickly.

Live Machine Visibility
Managers waited for operator reports. Therefore, output, status, and activity updates were unavailable while machines were running.
Cycle Count Recording
Teams entered cycle counts by hand. As a result, shift data took longer to prepare and became harder to verify.
Runtime and Idle Data
Runtime and idle details arrived after review. Therefore, managers could not quickly identify active, idle, or underused machines.
Efficiency Calculations
Efficiency depended on estimates instead of live activity. Therefore, performance reviews lacked reliable numbers for output and utilization.
Scattered Machine Records
Machine age, runtime history, cycle counts, and usage data stayed scattered. Therefore, analysis took more time than needed.
Slow Operational Decisions
Because data arrived late, managers spent more time finding gaps. Corrective action on the shop floor also became slower.
Solution Overview

A Connected IoT Layer That Turned Machine Activity Into Actionable Data

SDLC Corp built a machine monitoring layer for QuantusTechnik. It captures output, cycles, runtime, idle time, utilization, and efficiency without manual entry.

Live Data Capture

The system captures live machine activity automatically. Therefore, teams no longer rely on manual checks or operator-entered logs.

Performance Tracking

Managers review output, cycle count, utilization, and efficiency in one structured view. As a result, daily oversight becomes faster.

Usage History Visibility

Runtime and cycle history support machine age tracking accurately. Therefore, service planning gets cleaner usage data for each asset.

Dashboard-Ready Reports

Machine data is structured for dashboards and reports. Therefore, future analytics need less manual preparation and rework.
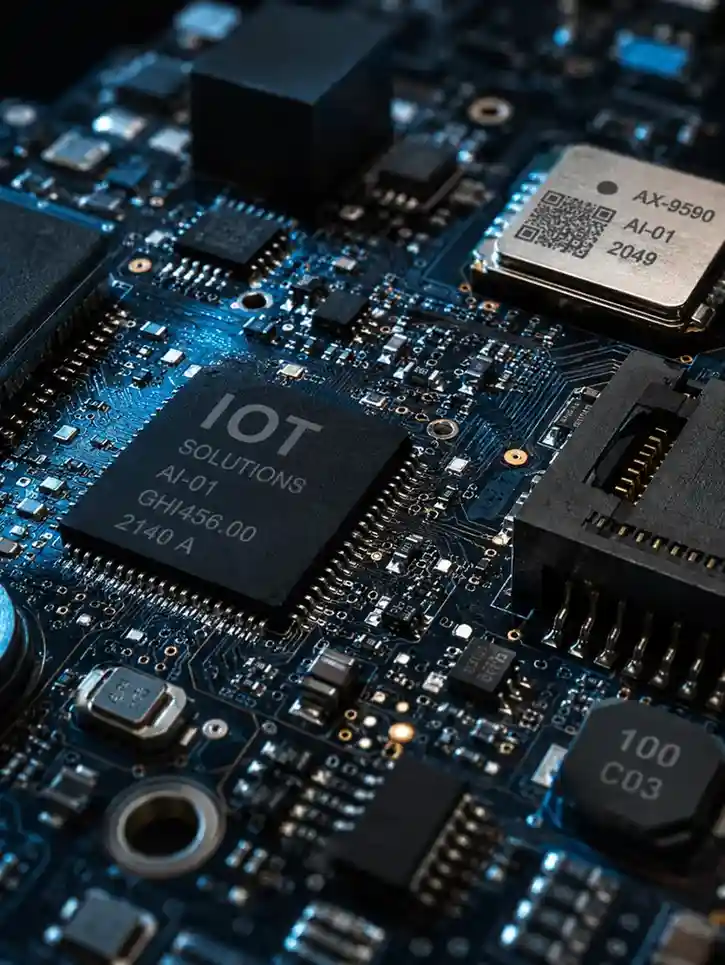
IoT data layer for machine monitoring system
Key Features

Six Monitoring Capabilities Built for Precision Manufacturing

Each feature solved a specific QuantusTechnik need. It reduced manual cycle logs and created analytics-ready reporting data for faster production review.

Feature 01

Output Tracking

The system records production output for each connected machine in real time. Therefore, managers compare targets and spot gaps faster.

Feature 02

Cycle Monitoring

The system captures machine cycles digitally instead of using operator logs. As a result, teams get accurate usage data.

Feature 03

Runtime Visibility

The system separates active, idle, and underused machine states in real time. Therefore, shift allocation becomes easier.

Feature 04

Usage History

The system reviews machine age through runtime, cycle count, and usage history. As a result, service planning becomes reliable.

Feature 05

Efficiency Calculation

The system calculates efficiency from output, runtime, cycle count, and utilization. Therefore, reviews use actual machine data.

Feature 06

Reporting Data

The system structures machine data for dashboards, scheduled reports, and analytics. This gives teams a clean reporting base.

```html
Technology Stack

A Layered IoT Architecture Built for Scalability

The system uses a structured multi-layer architecture. It separates machine data capture, metric computation, integration, reporting, and insights into clear layers. As a result, each layer can scale without affecting the core monitoring workflow.

Machine Layer

The system captures live machine activity from connected equipment. Then, it prepares clean events for processing and review.

Metric Layer

The system computes output, cycles, runtime, idle time, utilization, age, and efficiency through one structured layer.

Integration Layer

The system moves structured machine data through event routing and integration logic for reliable monitoring workflows.

Reporting Layer

The system creates dashboard-ready data for reports, trends, performance views, and utilization gap analysis.
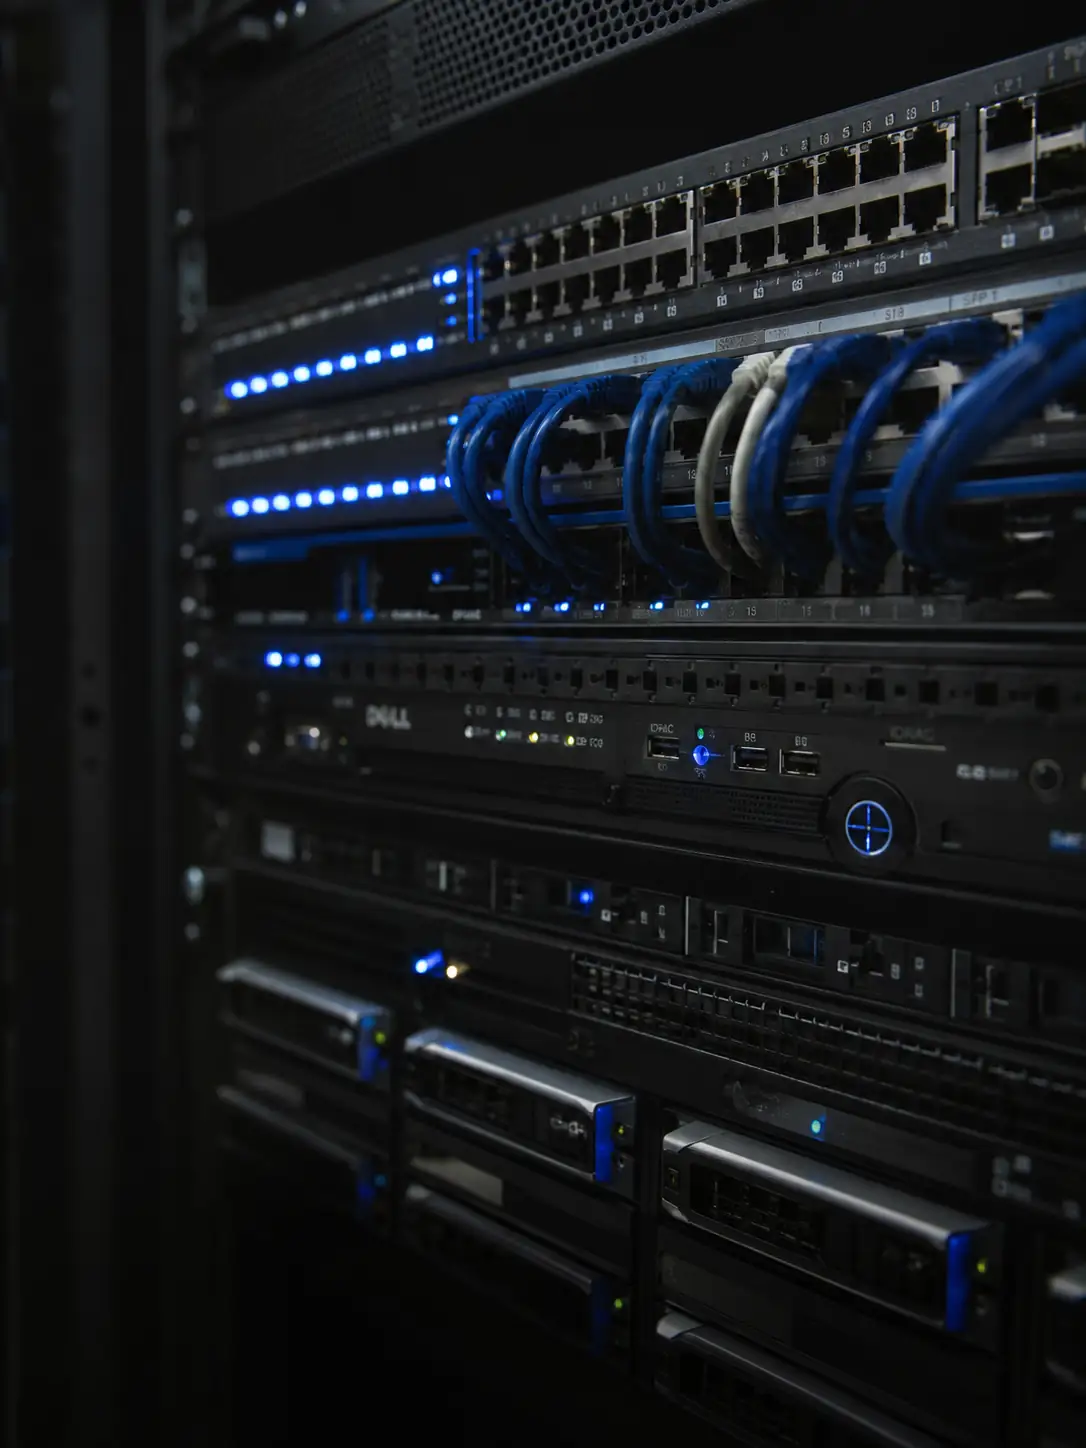
Architecture principle: Each layer handles one clear responsibility. Therefore, QuantusTechnik can expand reporting and analytics without rebuilding the core monitoring layer.
Layered IoT architecture for machine monitoring and real-time production data
```
Implementation Process

How SDLC Corp Built the Monitoring System in Six Phases

A structured delivery process helped SDLC Corp validate each stage before launch. It covered data identification, IoT planning, metric setup, reporting, testing, and final deployment.

1

Machine Workflow Study

SDLC Corp studied daily machine workflows. Then, the team mapped how shop-floor teams used machine data for faster decisions.

2

Data Point Identification

The team mapped key metrics such as output, runtime, idle time, cycle count, and efficiency to monitoring goals.

3

IoT Data Capture Planning

SDLC Corp planned how machine events would be detected, structured, and moved into the monitoring layer reliably.

4

Metric and Efficiency Model Setup

The team configured efficiency and utilization models. As a result, calculations used real machine activity data.

5

Data Processing and Reporting Structure

The system organized raw machine data into clean reporting views for dashboards, analysis, and future analytics.

6

Testing, Validation, and Deployment

Before go-live, SDLC Corp tested data accuracy, metric reliability, reporting readiness, and machine tracking coverage.

```html
Business Impact

Measurable Operational Improvements From Day One

The Industrial IoT monitoring system improved reporting efficiency, machine visibility, and decision speed at QuantusTechnik. As a result, teams acted faster with reliable data.

60% Less Manual Machine Reporting

Operator logs, shift summaries, and offline reports dropped. Therefore, teams spent less time recording data and more time improving output.

70% Faster Machine Monitoring Speed

Live machine data reached managers faster. As a result, teams found productivity gaps during the same shift and corrected them sooner.

7+ Machine Metrics Tracked Live

The system tracked output, runtime, idle time, cycle count, utilization, efficiency, and machine age through one monitoring layer.

Zero Manual Cycle Efficiency Logs

Digital cycle capture replaced estimated counts. Also, efficiency was calculated from real activity data across machines, operators, and shifts.

Better Machine Allocation Utilisation Control

Teams identified active, idle, and underused machines in real time. Therefore, capacity planning became more controlled and accurate.

Stronger Machine Maintenance Planning Base

Machine age used runtime and cycle history, not only purchase date. As a result, service planning became more accurate.

```
```html
Performance Comparison

Before vs After the Industrial IoT Monitoring System

See how IoT monitoring replaced manual tracking with real-time visibility and faster decisions.

CapabilityBaseline / BeforeOutcome / After
Machine Output Tracking Output was recorded manually, delaying production reports. Live output data improved production visibility.
Runtime & Idle Visibility Runtime and idle time were difficult to track. Runtime and idle patterns became clearly visible.
Cycle Count Accuracy Manual cycle counts caused gaps and inconsistent records. Automated capture improved cycle count accuracy.
Utilization Analysis Fragmented data made utilization difficult to measure. Unified data made utilization easier to compare.
Efficiency Reporting Manual data collection slowed efficiency reporting. Live data enabled faster efficiency reporting.
Operational Decision Speed Delayed production updates slowed operational decisions. Real-time data supported faster decisions.
```
Build Your Monitoring System

Monitor Machine Output, Runtime, and Efficiency Without Manual Reporting

SDLC Corp builds Industrial IoT machine monitoring systems for manufacturing and industrial companies. These systems replace manual logs with connected data and dashboard-ready reports.

  • Real-time output and cycle tracking
  • Runtime, idle time, and utilisation visibility
  • Efficiency from actual machine data
  • Dashboard-ready reporting from day one

Let’s Talk About Your Product

Get expert guidance on scope, architecture, timelines, and delivery approach so you can move forward with confidence.

What happens next?