
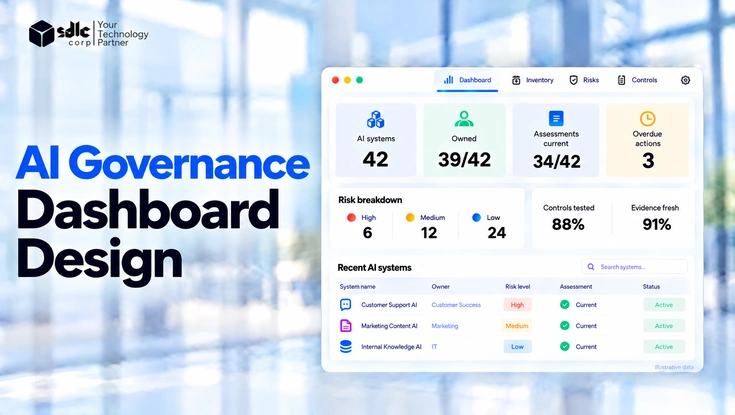
An effective AI governance dashboard connects your AI inventory, ownership, risk, controls, evidence, incidents, agent activity and cost to the decisions your organization needs to make.
As AI moves from experimentation to enterprise use, spreadsheets, policy documents and disconnected reports make oversight harder. In particular, leaders need a consistent view of which systems are in use, who owns them, where material risks sit and which actions are overdue.
Therefore, this guide explains how to design that view for executives, governance teams and technical stakeholders.
Key Takeaways
- Design the dashboard around governance decisions and expected actions.
- Track inventory, ownership, risk, controls, evidence, incidents, agents and cost.
- Separate leading indicators from lagging outcomes.
- Measure data quality and freshness alongside each KPI.
- Assign material risks, exceptions and remediation to accountable owners.
- Give executives, governance teams and technical users views suited to their decisions.
- Link important signals to thresholds, workflows and retained evidence.
- Keep dashboard visibility separate from technical enforcement.
What Is an AI Governance Dashboard?
In essence, an AI governance dashboard is the visibility and decision layer for an organization's AI estate. It should answer practical questions: What AI systems, models and agents exist? Who owns them? Which risks and obligations apply? Are required controls operating?
What needs a decision, and what evidence supports it?
Notably, the NIST AI Risk Management Framework organizes AI risk management around Govern, Map, Measure and Manage. However, it is voluntary and does not prescribe a dashboard design.
Instead, organizations should translate its concepts into metrics and workflows suited to their own risks and obligations.
Metrics That Support Governance Decisions
In short, dashboards become useful when measures reveal both whether governance processes are working and what happened after a failure.
Leading indicators
Use ownership coverage, assessment currency, control coverage, evidence freshness, permission reviews and exception expiry to spot weakening governance before an adverse event.
Lagging outcomes
By contrast, track incidents, policy violations, failed controls, remediation time, regulatory findings and confirmed harm. Even so, zero incidents alone cannot demonstrate strong governance when assessments or evidence are overdue.
A focused executive set of ten metrics
- AI inventory coverage
- Ownership coverage
- Assessment currency
- Material-risk exposure
- Risk concentration
- Control coverage and test status
- Evidence freshness
- Critical overdue remediation
- AI-related incidents and policy violations
- AI spend and usage anomalies
Give Each Role the Right View
One governance data foundation can support multiple views while preserving traceability from a leadership signal to the underlying record.
| Role | What the view should show | Typical decision |
|---|---|---|
| Executives | Material exposure, concentration, trends and overdue actions | Prioritize resources or accept risk |
| Governance teams | Ownership, assessments, controls, exceptions and evidence | Review, escalate or request remediation |
| Security and engineering | Relevant runtime events, policy decisions, system context and logs | Investigate and resolve an issue |
Connect Each Signal to an Action and Evidence
A red, amber or green status is only a starting point. Define what happens next, who owns it and which record proves the response occurred.
| Signal | Expected response | Evidence to retain |
|---|---|---|
| Missing assessment | Complete or escalate the assessment | Approved, dated assessment |
| Blocked privileged-agent action | Investigate the attempted action | Policy decision and execution record |
| Overdue remediation | Escalate according to policy | Updated ticket, decision or approval |
| Expired evidence | Refresh or review the record | Updated, dated evidence |
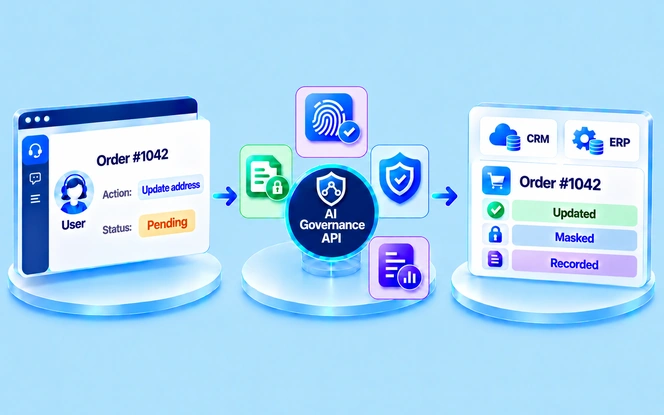
Monitor What AI Agents Do
Agent counts alone do not describe risk. For example, reading a knowledge base and modifying a production database have different potential impacts.
Where activity is material, capture the agent's identity, requested tool or resource, requested permission, policy evaluation and decision, applicable obligations, human approval when required, execution outcome, timestamp and linked evidence.
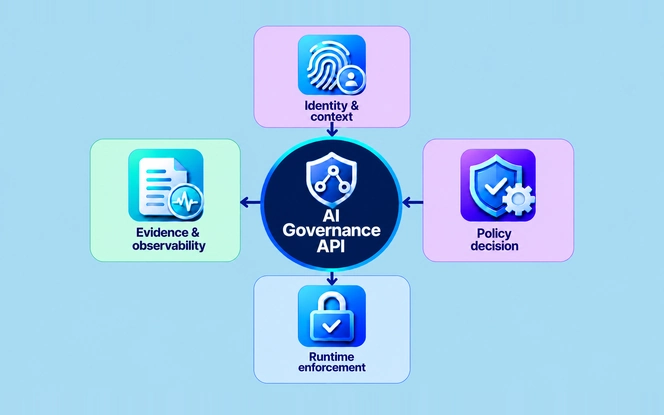
Naturally, monitoring depth should reflect the impact of the action. Higher-impact activities generally call for stronger authorization, monitoring and records. The dashboard reports these events; access, deployment and runtime systems enforce the underlying controls, which an AI governance platform architecture connects end to end.
Add Context to Risk, Cost and Evidence
Risk concentration
Admittedly, “14 high-risk systems” is hard to act on by itself. In an illustrative example, eight of 14 internally high-priority systems sit in one business unit, five process sensitive data and three have overdue assessments. As a result, that breakdown supports prioritization.
Internal risk ratings must, however, be distinguished from any formal regulatory classification.
Cost in context
Review spend by business unit, application or provider; model or token use; budget variance; usage spikes; and costly agent workflows. Then ask whether spend has an approved purpose, accountable owner and acceptable risk.
Evidence quality is part of data quality
For instance, an internal evidence-quality model may distinguish missing, self-attested, system-generated, reviewed, independently validated and expired records. Still, label it as an internal approach, not a universal assurance standard. In addition, show the record's owner, source and review date so readers can judge its reliability.
How to Build the Dashboard
Above all, start with a trustworthy AI inventory and named ownership. Add risk and control data, then evidence, remediation and executive reporting. Extend to runtime agent telemetry and advanced optimization once foundational data is reliable.
Meanwhile, security and agent events may need event-driven or near-real-time visibility; inventory, evidence and cost often tolerate slower cycles.
Map to Frameworks Without Overclaiming Compliance
Generally, use frameworks as governance references, not dashboard specifications. One practical mapping puts ownership and policy coverage under NIST AI RMF Govern; inventory and context under Map; risk and control metrics under Measure; and remediation and incidents under Manage.
Likewise, ISO/IEC 42001:2023 provides an AI management-system reference.
Framework mapping helps organize evidence. However, it does not, by itself, prove compliance or replace analysis of applicable laws and obligations.
Build, Buy or Extend?
Building may fit highly specific governance workflows when reliable internal data pipelines already exist. By comparison, buying or extending a platform may be more practical when inventory, assessments, evidence, controls and reporting are available.
Compare integration coverage, identity and permissions, data lineage, evidence handling, audit logs, custom metrics, workflow support, enforcement integrations, scalability and total cost of ownership.
Implementation checklist
- First, inventory relevant AI systems, models, agents and third parties.
- Record ownership and lifecycle status.
- Next, define risk classifications and assessment status.
- Document KPI formulas, sources, owners and freshness.
- Track control and evidence status.
- Then surface incidents, exceptions and remediation.
- Show concentration and material exposure.
- Set thresholds and expected responses.
- Apply role-appropriate access.
- Finally, retain records that reconstruct material decisions.
Sources and editorial scope
This guide draws on the framework references listed below and on SDLC Corp's published product documentation. Moreover, formulas, dashboard layouts and example thresholds are implementation guidance, not claims of certification. The 14-system scenario and dashboard percentages above are illustrative.
SDLC Corp publishes this guide and provides Foresite; product capabilities are attributed to its product page.
- NIST AI Risk Management Framework: voluntary risk management reference.
- ISO/IEC 42001:2023: AI management-system standard.
- SDLC Corp Foresite product page: source for product-specific capabilities.
Make Governance Actionable
Connect trusted metrics, ownership and audit trails to better AI governance decisions. Explore SDLC Corp's Foresite for governed dashboards and traceable evidence.
Conclusion
An AI governance dashboard should be judged by the decisions it improves, not the number of charts it contains. Ultimately, a strong design connects inventory, ownership, risk, controls, evidence, incidents, agent activity and cost with clear accountability.
That connection helps leadership prioritize material exposure, gives governance teams a way to manage incomplete controls and evidence, and gives technical teams the context to investigate important events. In the end, the objective is to make governance actionable, accountable and auditable.
Frequently asked questions
What should an AI governance dashboard include?
At minimum, include AI inventory, ownership, risk, controls, evidence, incidents and remediation. Then add agent activity, cost and governance-data quality metrics where they materially affect decisions.
Which AI governance metrics should executives see first?
Start with inventory coverage, ownership coverage, assessment currency, material-risk exposure, control status, evidence freshness, overdue remediation, incidents and cost or usage anomalies.
Should the dashboard show one overall AI risk score?
Not necessarily. In fact, a single score can hide differences between security, privacy, compliance, reliability and operational risk. Therefore, if used, document its calculation, weighting, freshness and limitations.
How often should AI governance data refresh?
Match refresh frequency to decision speed. Agent and security events may require event-driven or near-real-time visibility, while inventory, evidence and cost data may support slower cycles.
Does an AI governance dashboard prove compliance?
No. It provides visibility, evidence and workflow support. Instead, compliance depends on applicable obligations and the organization's actual controls, processes and decisions.