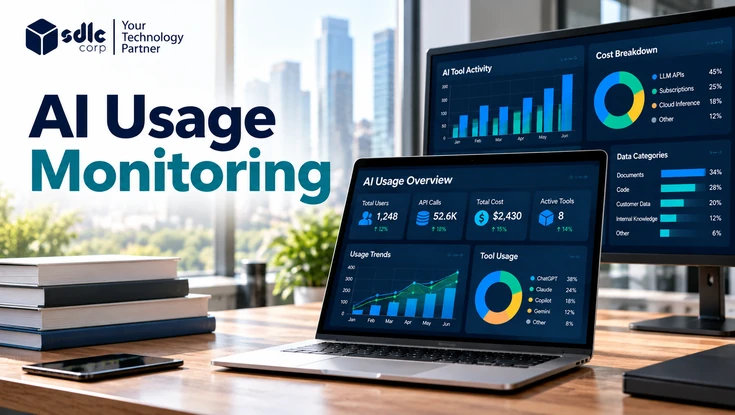
AI usage monitoring gives organizations visibility into how employees, applications, APIs, and AI agents use generative AI, connecting usage, identity, data movement, cost, and runtime activity rather than relying on a single dashboard.
Enterprise AI usage monitoring answers six questions: who is using AI, which tools and models are involved, how much, what data moves through them, what it costs, and what risk it creates. The clearest programs split this across three layers: workforce AI usage, AI workload and API usage, and AI runtime or agent behaviour.
What a complete AI monitoring view should connect
However, A monitoring program becomes more useful when individual signals can be correlated into an operational picture.
In addition, Monitoring depth should match risk, privacy requirements, architecture, and whether the organization is monitoring employees, applications, or autonomous agents.
- IdentityIdentify the employee, application, service, project, or non-human agent initiating activity.
- However, Discovery Identify sanctioned and unsanctioned AI services, embedded SaaS AI features, APIs, and internal AI applications.
- UsageMeasure models, requests, tokens, frequency, latency, errors, and other relevant consumption signals.
- As a result, Data Determine what sensitive or regulated information reaches AI systems and where policy controls apply.
- RuntimeReconstruct retrieval, model calls, tool execution, permissions, API calls, and downstream agent actions.
- At the same time, Governance Turn monitoring evidence into policies, investigations, alerts, reporting, and appropriate enforcement.
What Is AI Usage Monitoring?
AI usage monitoring is the process of identifying, measuring, analyzing, and governing how employees, applications, APIs, and AI agents interact with generative AI systems and large language models.
In practice, In practical terms, an enterprise monitoring program should establish who is using AI, which tools and models are involved, how much they are being used, what data is moving through them, what the activity costs, and what risk or business impact it creates.
AI usage monitoring overlaps with, but is not identical to, AI observability and AI model monitoring. As a result, Usage monitoring focuses on enterprise usage, ownership, governance, risk, and cost. In practice, AI observability goes deeper into application runtime behaviour such as model calls, retrieval, tool execution, traces, and workflows. Meanwhile, Model monitoring focuses on model-specific performance measures such as reliability, latency, or drift.
Meanwhile, A company can have detailed application observability and still have little visibility into employees using personal AI accounts. Conversely, it may identify an employee's AI request without understanding what an internal agent did afterward.
That distinction is important when defining the scope of an enterprise AI development and governance program.
Why Enterprises Need AI Usage Monitoring
Therefore, Generative AI can enter an organization through public websites, enterprise assistants, coding tools, SaaS features, APIs, internal applications, and autonomous agents. Each route creates a different visibility challenge. Effective monitoring covers both sanctioned systems and Shadow AI, while distinguishing how each source generates risk and telemetry.
of malicious breaches were AI-enabled in the 2026 study period, a 56% rise year over year. Those breaches averaged $6 million against a $4.99 million global average.
IBM and Ponemon Institute, 2026 Cost of a Data Breach Report, 29 July 2026. 602 organizations, breaches between March 2025 and February 2026. View sourceof organizations have had AI agents act beyond the permissions they were intended to hold, which is a runtime behaviour problem rather than an access-request problem.
Cloud Security Alliance AI Safety Initiative, Shadow AI Apps: The Enterprise Attack Surface That Outpaces Monitoring, 30 May 2026. View sourceworkers use AI outside IT oversight, while seven in ten use AI tools at least a few times a week. Usage is routine before it is governed.
Lenovo, Work Reborn Research Series 2026, reported 1 May 2026. Global survey of 6,000 full-time employees. View sourceShadow AI Monitoring And Unmanaged Usage
Employees may use consumer AI services, personal accounts, browser extensions, SaaS AI features, or unmanaged integrations without security teams knowing they exist. At the same time, The concern is not simply that a tool is unapproved. Organizations also need to understand who uses it, what business purpose it serves, what information reaches it, and whether an approved alternative exists.
see IBM's discussion of Shadow AI and AI-related security exposure.
Data Exposure
Likewise, A developer may paste source code into a coding assistant. Moreover, A support team may send customer information to an AI service. In addition, An employee may upload an internal document to a consumer chatbot.
Application access alone is therefore not enough. For example, Monitoring may need to connect identity, destination, data classification, DLP signals, and organizational policy.
Cost Attribution
Therefore, AI spending can come from subscriptions, LLM APIs, cloud inference, token usage, multiple models, and agents that make several model calls for one task. A monthly invoice tells finance how much was spent, but it may not explain which application, team, workflow, model, or agent generated that cost.
OpenAI's API Usage Dashboard, for example, provides project and user filtering, token usage, and usage exports. Amazon Bedrock CloudWatch metrics can provide visibility into invocation volume, latency, token consumption, and errors.
Usage Is Not The Same As Value
However, A high number of prompts does not prove business impact. As a result, Monitoring should establish where AI is being used, while a separate measurement layer should determine whether that use saves time, improves quality, increases revenue, reduces cost, or changes another meaningful business outcome.
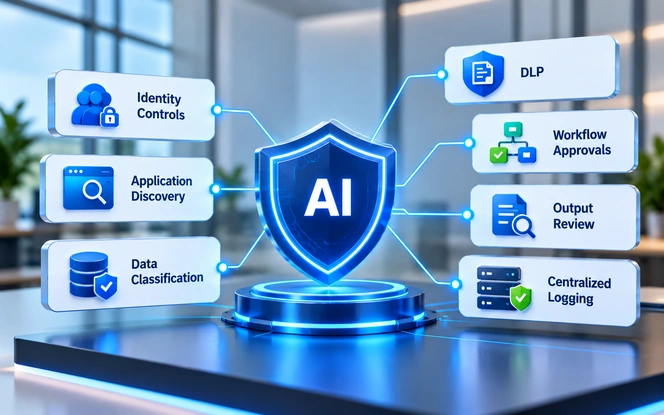
The Enterprise AI Visibility Model: Three Layers Of AI Monitoring
In practice, A useful enterprise monitoring strategy separates visibility into three connected layers. Meanwhile, The layers answer different questions and should be correlated where possible.
Layer 1: Workforce AI Usage
For instance, This layer covers employees and the AI services they access: public AI websites, enterprise copilots, coding assistants, browser extensions, and AI features embedded in SaaS applications.
- Who is using AI?
- Which services are being used?
- Is Shadow AI present?
- Are approved tools actually being adopted?
If an employee accesses a consumer AI service through a browser and uploads an internal document, endpoint, network, identity, and DLP signals may provide different pieces of that event. No single source necessarily tells the complete story.
Layer 2: LLM Usage Monitoring, AI Workloads And APIs
By contrast, At this layer covers the applications and infrastructure generating AI consumption. It includes model calls, APIs, tokens, projects, cloud AI services, latency, errors, and cost. LLM and API telemetry becomes actionable when provider consumption is tied to the application, project, workflow, or team that generated it.
It becomes particularly important when a company builds its own AI applications. Provider telemetry can show consumption and performance, while application telemetry can connect requests to the application or workflow that generated them.
Layer 3: AI Agent Monitoring And Runtime Behaviour
At this layer asks what happens after an AI request enters an application. For an AI agent, that can include retrieval, model calls, tool execution, database access, API calls, permissions, MCP servers, and downstream actions. Agent traces and event lineage reconstruct those multi-step runtime behaviours.
More importantly, Key question: What could this agent access, what did it actually access, and what action did it take?
That is different from simply knowing that an employee used an AI assistant.
What Each AI Monitoring Method Can And Cannot See
In turn, No single telemetry source provides complete enterprise AI visibility. The monitoring method needs to match the question the organization is trying to answer.
Monitoring visibility and blind spots
| Monitoring method | Useful visibility | Important blind spot |
|---|---|---|
| Network / traffic monitoring | AI destinations, traffic patterns, sanctioned or unsanctioned services | May not show internal agent behaviour |
| Endpoint monitoring | AI applications, browser extensions, devices | Can miss cloud-side runtime activity |
| API / provider telemetry | Models, requests, tokens, latency, errors, usage and cost | May miss consumer AI use through browsers |
| DLP / data monitoring | Sensitive-data movement and policy events | May lack business context |
| Application observability | Model calls, retrieval, tools, traces and workflows | Does not automatically discover every external AI service |
| Agent / runtime monitoring | Tool use, permissions, execution and downstream actions | Requires instrumentation and agent identity context |
This is why an enterprise may need several complementary controls rather than one “AI monitoring” product.
How To Build An Enterprise AI Monitoring Program
Start With An AI Inventory
For example, Identify enterprise assistants, consumer AI services used for work, coding tools, SaaS AI features, internal AI applications, LLM APIs, cloud AI services, and AI agents.
- Record the owner and provider.
- Document the business purpose.
- Define permitted data classifications.
- Record integration points and review status.
Connect Activity To Identity
For employees, identity means users, teams, and departments. In addition, for applications, it means projects and services. However, for agents, it means non-human identity, permissions, tools, credentials, connected data, and workflows.
Then decide how much monitoring depth is actually necessary. Not every environment requires routine collection of prompt and response content. A lower-risk discovery program may only need application and usage metadata, while higher-risk environments may require data classification or DLP signals.
Apply Purpose And Privacy Controls
Content-level telemetry should have a defined purpose, access control, and retention policy. Worker monitoring should also consider necessity, proportionality, transparency, data minimization, and less intrusive alternatives.
The UK Information Commissioner's Office guidance on monitoring workers provides a useful reference for these principles.
Attribute AI Cost And Token Usage To Owners And Workloads
A useful cost model connects:
In addition, Without that correlation, token counts are mostly infrastructure data. With it, finance can identify expensive workloads, engineering can investigate inefficient applications, and business teams can connect AI spending to actual workflows.
For example, a finance team may see $40,000 of monthly LLM spend at the provider level. Attribution changes the question from “Why did AI cost $40,000?” to “Which application, workflow, team, or agent generated that spend?”
Cost monitoring becomes operationally useful when spending can be traced to the workload or business activity that generated it. Token and provider costs become more useful when attributed to owners, applications, workflows, models, and business purposes.
Monitor AI Agents Beyond The Initial Prompt
However, Agent monitoring should cover more than the original user request. For a production agent connected to a CRM, monitoring may need to capture its identity, model calls, retrieval sources, tool permissions, API requests, data access, and actions such as creating or modifying records.
Model Context Protocol (MCP) can be part of this architecture. MCP is a protocol for connecting AI applications to external tools and data sources; the permissions and access available to an agent depend on how the client, server, authentication, and authorization controls are implemented.
What was the agent authorized to do, what did it actually do, and can the organization investigate the result?
Build Event Lineage For AI Actions
As a result, Individual logs are not enough when an AI agent performs multiple steps. A useful monitoring architecture should correlate the initiating identity with the request, retrieved context, model and version, policy or guardrail decisions, tool calls, tool results, outputs, resource usage, and downstream actions.
If an agent changes a CRM record unexpectedly, an investigation should not stop at “the agent made an API call.” The organization should be able to reconstruct who initiated the workflow, what information the agent retrieved, which tools it used, what policy decisions were applied, and what happened afterward.
Enterprise AI Monitoring Architecture: Six Core Capabilities
At the same time, A practical architecture can be built around six capabilities: identity, discovery, telemetry, data protection, analytics, and governance.
Establish who or what generated activity and connect events to users, applications, services, and agents.
In practice, Identify AI applications, services, APIs, embedded SaaS AI features, and internal AI workloads.
Collect relevant signals from APIs, endpoints, networks, cloud platforms, and applications.
Add classification, DLP, access, and data-flow signals where the risk requires them.
Connect usage, cost, adoption, anomalies, risk, and operational outcomes.
Turn evidence into policies, investigations, alerts, reporting, and enforcement.
OpenTelemetry semantic conventions provide standardized terminology for telemetry, while GenAI-specific conventions are being developed separately. Organizations should also be careful with content-level telemetry because prompts, outputs, retrieval queries, and tool information can contain sensitive data.
For AWS environments, Amazon Bedrock runtime metrics document signals such as invocation volume, latency, token consumption, and errors.
How To Choose An AI Usage Monitoring Solution
Start with the questions the organization needs to answer, then map them to monitoring capabilities. This keeps vendor evaluation focused on coverage rather than feature lists.
| Organizational question | Capability to prioritize |
|---|---|
| Which AI tools are being used? | AI application discovery |
| Who is using them? | Identity and user attribution |
| Is sensitive data reaching AI services? | DLP and data-flow monitoring |
| Where is LLM spending going? | API, token, and cost attribution |
| What are internal agents doing? | Runtime and agent observability |
| Which SaaS AI services need controls? | CASB / SSE capabilities |
| How are internal AI applications performing? | Application observability |
| Can activity be investigated and governed? | Policy, reporting, and auditability |
Integrations To Verify
Coverage depends on the telemetry a platform can actually reach. Confirm each of these against the systems already in place.
Attributes every AI request to a named user, group, and role.
Surfaces local AI apps, browser extensions, and desktop assistants.
Detects traffic to AI domains that no agent or SaaS log reports.
Covers AI services consumed inside existing cloud accounts.
Reads token, model, and request data straight from the provider.
Flags sensitive content moving into prompts, files, and attachments.
Routes AI events into the alerting and response workflows already in use.
Links internal AI features to latency, errors, and agent actions.
A suitable platform makes its coverage boundaries clear, supports the telemetry sources already in use, and connects AI activity to identity, cost, data risk, runtime behaviour, and governance decisions.
Enterprise AI implementation
Connect AI development with monitoring and governance
Organizations building internal AI applications or agentic workflows can consider monitoring during architecture rather than adding it after deployment. SDLC Corp provides enterprise AI development services and Foresite, its AI usage monitoring and policy enforcement platform, which can be evaluated against the coverage requirements above.
AI Monitoring Tools By Category
No single category covers enterprise AI use. Each one answers part of the question and leaves a gap that another category has to close. Read the table as a coverage map rather than a shortlist.
| Category | What it sees | What it misses | Typical owner |
|---|---|---|---|
| AI application discovery / SSE and CASB | Which AI services are reached, from which accounts and devices | What happens inside an approved tool once access is granted | IT and security |
| Identity and access management | Who authenticated, with which role, to which AI service | Activity on personal accounts that never touches SSO | Identity team |
| Data loss prevention and DSPM | Sensitive content moving into prompts, files and attachments | Sensitive meaning that no classifier is trained to recognise | Security and data governance |
| LLM gateways and API proxies | Model, token, latency and cost per request for routed traffic | Traffic that bypasses the gateway entirely | Platform engineering |
| AI and LLM observability | Prompts, responses, traces, quality and error rates in your own apps | Third-party SaaS AI features you do not instrument | Engineering |
| Agent runtime and action logging | Tools called, actions taken, and whether scope was exceeded | Reasoning that produced the action | Platform and security |
| Cloud and SaaS posture management | AI services enabled inside existing cloud and SaaS tenants | Shadow tools outside those tenants | Cloud and IT |
| FinOps and cost attribution | Spend by model, team, workload and environment | Business value delivered for that spend | Finance and FinOps |
| SIEM and SOAR | Correlated AI events alongside the rest of security telemetry | Anything the upstream sources never sent | Security operations |
| GRC and governance platforms | Policies, controls, owners, exceptions and audit evidence | Live technical activity, unless fed from the sources above | Governance and compliance |
Most organizations already own several of these categories. The usual gap is not a missing product but the absence of a link between identity, data, cost and runtime signals.
Foresite Walkthrough: Capture, Dashboard And Enforcement
The capability table above describes what each monitoring category can do. This walkthrough shows one implementation of it end to end, using screens from Foresite, SDLC Corp's AI usage monitoring and policy enforcement platform.
Prompts Are Captured In The Browser, With Consent
Foresite works at the point where staff actually use AI: the browser. The product page states the capture is consent-based and the deployment self-hosted, and it covers ChatGPT, Claude, Gemini and seven further platforms.

- Capture happens before the prompt leaves the browser, which is what makes blocking possible
- Each entry carries the person, their department, and the AI platform used
- A policy rule that fires is named on the entry, for example a card-number rule stopping a prompt pre-send
Activity Arrives On The Dashboard In Real Time
Captured prompts stream to a dashboard rather than landing in a log that someone exports later. This is the difference between monitoring that supports a decision and monitoring that only supports an investigation.

- A live feed over websockets, so the view updates without a refresh
- Totals for prompts today, blocked attempts and estimated tokens
- Charts broken down by platform, department and person
- Every prompt classified by intent and topic automatically
Policy Is Enforced Before The Prompt Is Sent
The step that separates enforcement from reporting. Rules are authored centrally and applied in the browser extension at submission time, so a prompt that breaks policy never reaches the AI provider.

- Admins write restricted-question rules in the console
- The extension blocks matching prompts before submission
- Blocked attempts are reported with a confidence score
- The employee is shown exactly why the prompt was stopped
The figures and names in these screens are demonstration data from the product itself. They are shown to illustrate the interface and the sequence of steps, not the results of a customer deployment.
What AI Monitoring Still Cannot See
Every monitoring method has blind spots. Network controls may identify AI traffic without understanding what an internal agent did. Endpoint controls may miss unmanaged devices. API monitoring can provide detailed token and cost information while missing consumer AI usage through browsers. DLP can identify sensitive-data movement without understanding the full business context.
Application observability can expose an internal agent's behaviour without discovering every external AI service. Shared API keys and cloud accounts can also weaken attribution, while embedded AI features inside SaaS products create another visibility gap.
A system should not be evaluated only by what it detects. Document what the monitoring architecture cannot prove so that investigation and governance expectations remain realistic.
AI Monitoring Coverage: Six Questions To Measure
An organization can assess monitoring coverage across six dimensions.
Can we identify who or what initiated the activity?
Can we find sanctioned and unsanctioned AI usage?
Can we measure models, APIs, tokens, and frequency?
Can we determine what sensitive data reaches AI systems?
Can we reconstruct agent and tool activity?
Can we investigate and act on violations?
Meanwhile, This is more useful than asking whether an organization simply “has AI monitoring.” A monitoring program is only as useful as the signals it can connect to a decision.
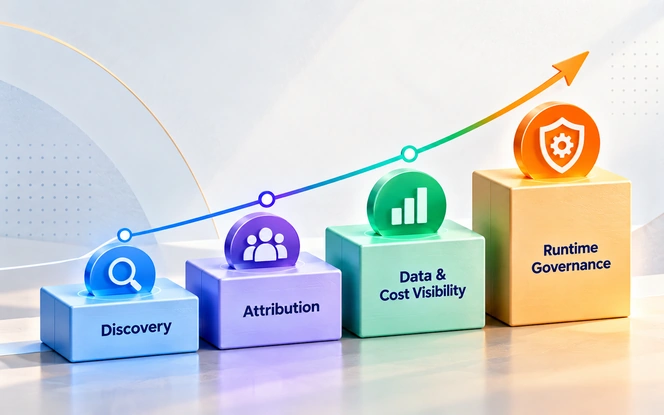
AI Monitoring Maturity
Monitoring should mature with the AI environment. An organization with no reliable AI inventory can start with discovery and attribution. Once that foundation exists, it can strengthen data protection, cost visibility, runtime monitoring, and governance.
Therefore, Build an inventory of AI services, applications, models, APIs, owners, and business purposes.
Connect activity to users, projects, applications, teams, workflows, and agents.
Add DLP, classification, token, spend, and anomaly signals according to risk and business need.
For instance, For production agents, add permissions, tool, retrieval, API, action, and event-lineage monitoring.
A company facing rapidly increasing LLM costs may need stronger API and cost attribution before investing in sophisticated agent observability. A company already deploying production agents may need deeper runtime, permission, tool, and action monitoring.
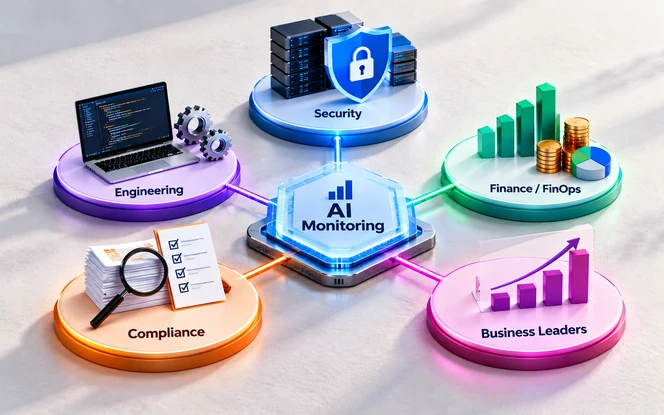
How Different Teams Use AI Monitoring
| Team | Primary monitoring needs |
|---|---|
| Security | Shadow AI, sensitive-data exposure, identity, policy violations, and agent risk |
| Engineering | Model usage, latency, errors, traces, tool calls, and application behaviour |
| Finance / FinOps | Provider spend, model costs, tokens, projects, teams, and workflow-level attribution |
| Compliance | Evidence around data handling, access, retention, monitoring practices, and auditability |
| Business leaders | Adoption, approved-tool usage, workflow impact, and measurable outcomes |
By contrast, Enterprise AI monitoring is not a single-team dashboard. Security focuses on exposure and misuse; compliance needs evidence; finance needs spend attribution; engineering needs deeper LLM and agent telemetry.
How To Measure AI Monitoring Success
Track each metric alongside what it actually tells you, so a rising number is read as a signal rather than a result.
How much of the estate was invisible before monitoring started.
Whether cost can be tied to an owner, team, or workload.
How often regulated or confidential content reaches an AI service.
Where written rules and actual behaviour diverge.
Whether sanctioned tools are displacing unmanaged ones.
Actions taken by agents that exceeded their intended scope.
Spend movements large enough to need an explanation.
Measurable change in the work the monitoring was meant to support.
For an initial monitoring program, organizations can use the first 30–60 days as a practical baseline period, then adjust the measurement window based on usage volume, seasonality, and risk.
A sudden increase in detected events after deployment may simply mean the organization can finally see activity that was previously invisible. The real outcome is whether teams can investigate those signals, apply appropriate controls, reduce unnecessary risk or spend, and improve how AI is operated.
What Should An AI Monitoring System Track?
An AI monitoring system needs signals from applications and services, human and non-human identities, model and API usage, token consumption, costs, data movement, permissions, retrieval activity, tool calls, agent actions, policy events, errors, and relevant downstream outcomes. Together, these signals support operational dashboards, investigations, usage analysis, and governance reporting.
More importantly, The exact depth depends on risk, privacy requirements, architecture, and whether the organization is monitoring employees, applications, or autonomous agents.
How We Built This Framework
The three-layer model in this article is an operating structure, not a published standard. It was assembled from three inputs:
- The governance functions in the NIST AI Risk Management Framework, which separates governing, mapping, measuring and managing. NIST states these are not a fixed sequence.
- The management-system requirements in ISO/IEC 42001, which treat AI oversight as something established, maintained and continually improved rather than documented once.
- The published research cited above, which is where the layer boundaries come from: workforce usage, workload and API usage, and agent runtime behaviour each surface in a different telemetry source and fail in a different way.
Where this article gives thresholds or maturity stages, those are proposed operating defaults for teams to adapt, not industry benchmarks. Figures that are not attributed to a named source are not measurements.
Turn AI Usage Data Into Actionable Enterprise Visibility
Build a clearer view of AI usage, workloads, costs, data exposure, and agent activity across your organization.
Conclusion
In turn, AI usage monitoring is no longer just about knowing which AI websites employees visit. At enterprise scale, it means understanding who is using AI, which applications and models are involved, what data is being processed, what the activity costs, what agents can access, what they actually do, and what risks follow from that activity.
The Enterprise AI Visibility Model provides a practical way to approach this problem through three connected layers: workforce AI usage, AI workload and API consumption, and AI runtime or agent behaviour.
For example, The goal is not to collect every interaction. It is to collect the right signals for the right risks and connect those signals to decisions about security, cost, governance, adoption, and business value.
Frequently Asked Questions
AI usage monitoring tracks how employees, applications, APIs, and AI agents use generative AI systems, including tools, models, data, usage, cost, and risk.
In addition, AI usage monitoring focuses on enterprise usage, ownership, governance, risk, and cost. AI observability focuses more deeply on application runtime behaviour, including traces, model calls, retrieval, tools, and workflows.
Organizations can combine network telemetry, endpoint data, identity information, SaaS and OAuth reviews, and provider-level usage data to identify sanctioned and unsanctioned AI services.
Not necessarily. Monitoring depth should match the risk and purpose. Metadata, identity, classification, and DLP signals may provide sufficient visibility in many cases, while content-level monitoring should have a clearly defined purpose and appropriate privacy controls.
Agent monitoring should include identity, permissions, tools, model calls, retrieval, data access, runtime activity, and downstream actions. For environments using MCP, organizations should also govern which users or agents can access which MCP servers and tools.
However, Organizations can assess coverage across identity, AI discovery, usage, data, runtime activity, and governance. The goal is to determine whether these signals can be connected well enough to investigate activity and make operational decisions.
Track requests, tokens, latency, errors and provider cost, then attribute those signals to the application, workflow, team or agent that generated them. That turns raw provider consumption into information engineering and finance teams can act on.
Start with the questions the organization needs to answer. Then test whether the solution covers identity, AI discovery, LLM and API usage, cost, data protection, agent runtime activity, integrations, investigations and governance. Require the vendor to state what the product cannot see as clearly as what it can.